Elementary Statistics: Picturing the World Books a la carte Plus MyLab Statistics with Pearson eText -- Access Card Package (7th Edition)
7th Edition
ISBN: 9780134685205
Author: Ron Larson, Betsy Farber
Publisher: PEARSON
expand_more
expand_more
format_list_bulleted
Concept explainers
Videos
Textbook Question
Chapter 4.2, Problem 4E
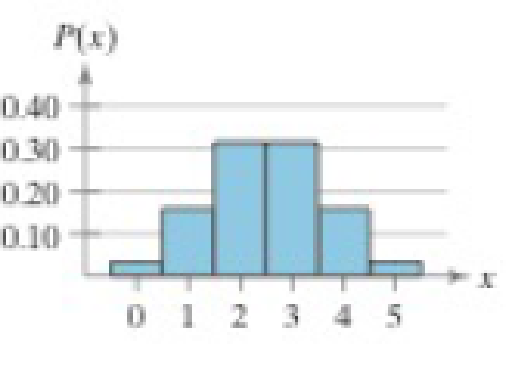
Graphical Analysis In Exercises 3–5, the histogram represents a binomial distribution with 5 trials. Match the histogram with the appropriate
(a) p = 0.25 (b) p = 0.50 (c) p = 0.75
4. 
Expert Solution & Answer
Want to see the full answer?
Check out a sample textbook solution
Students have asked these similar questions
Question 2
The data below provides the battery life of thirty eight (38) motorcycle batteries.
100 83 83 105 110 81 114
99 101 105 78 115 74 96
106
89
94 81 106 91 93 86
79 103 94 108 113 100
117 120
77 93
93 85 76
89 78 88
680
a. Test the hypothesis that mean battery life is greater than 90. Use the 1% level of
significance.
b. Determine if the mean battery life is different from 80. Use the 10% level of
significance. Show all steps for the hypothesis test
c. Would your conlcusion in part (b) change at the 5% level of significance? |
d. Confirm test results in part (b) using JASP. Note: All JASP input files and output
tables should be provided
Suppose that 80% of athletes at a certain college graduate. You randomly select eight athletes. What’s the chance that at most 7 of them graduate?
Suppose that you flip a fair coin four times. What’s the chance of getting at least one head?
Chapter 4 Solutions
Elementary Statistics: Picturing the World Books a la carte Plus MyLab Statistics with Pearson eText -- Access Card Package (7th Edition)
Ch. 4.1 - Determine whether each random variable x is...Ch. 4.1 - A company tracks the number of sales new employees...Ch. 4.1 - Verify that the distribution you constructed in...Ch. 4.1 - Determine whether each distribution is a...Ch. 4.1 - Find the mean of the probability distribution you...Ch. 4.1 - Find the variance and standard deviation of the...Ch. 4.1 - At a raffle, 2000 tickets are sold at 5 each for...Ch. 4.1 - What is a random variable? Give an example of a...Ch. 4.1 - What is a discrete probability distribution? What...Ch. 4.1 - Is the expected value of the probability...
Ch. 4.1 - What does the mean of a probability distribution...Ch. 4.1 - True or False? In Exercises 58, determine whether...Ch. 4.1 - True or False? In Exercises 58, determine whether...Ch. 4.1 - True or False? In Exercises 58, determine whether...Ch. 4.1 - True or False? In Exercises 58, determine whether...Ch. 4.1 - Graphical Analysis In Exercises 912, determine...Ch. 4.1 - Graphical Analysis In Exercises 912, determine...Ch. 4.1 - Graphical Analysis In Exercises 912, determine...Ch. 4.1 - Graphical Analysis In Exercises 912, determine...Ch. 4.1 - Discrete Variables and Continuous Variables In...Ch. 4.1 - Discrete Variables and Continuous Variables In...Ch. 4.1 - Discrete Variables and Continuous Variables In...Ch. 4.1 - Discrete Variables and Continuous Variables In...Ch. 4.1 - Discrete Variables and Continuous Variables In...Ch. 4.1 - Discrete Variables and Continuous Variables In...Ch. 4.1 - Constructing and Graphing Discrete Probability...Ch. 4.1 - Constructing and Graphing Discrete Probability...Ch. 4.1 - Finding Probabilities Use the probability...Ch. 4.1 - Finding Probabilities Use the probability...Ch. 4.1 - Unusual Events In Exercise 19, would it be unusual...Ch. 4.1 - Unusual Events In Exercise 20, would it be unusual...Ch. 4.1 - Determining a Missing Probability In Exercises 25...Ch. 4.1 - Determining a Missing Probability In Exercises 25...Ch. 4.1 - Identifying Probability Distributions In Exercises...Ch. 4.1 - Identifying Probability Distributions In Exercises...Ch. 4.1 - Finding the Mean, Variance, and Standard Deviation...Ch. 4.1 - Baseball The number of games played in each World...Ch. 4.1 - Finding the Mean, Variance, and Standard Deviation...Ch. 4.1 - Finding the Mean, Variance, and Standard Deviation...Ch. 4.1 - Hurricanes The histogram shows the distribution of...Ch. 4.1 - Reviewer Ratings The histogram shows the reviewer...Ch. 4.1 - Writing The expected value of an accountants...Ch. 4.1 - Writing In a game of chance, what is the...Ch. 4.1 - Finding an Expected Value In Exercises 37and 38,...Ch. 4.1 - A high school basketball team is selling 10 raffle...Ch. 4.1 - Linear Transformation of a Random Variable In...Ch. 4.1 - Prob. 40ECh. 4.1 - What is the average sum of their scores? What is...Ch. 4.1 - What is the standard deviation of the difference...Ch. 4.2 - Determine whether the experiment is a binomial...Ch. 4.2 - A card is selected from a standard deck and...Ch. 4.2 - A survey found that 52% of U.S. adults associate...Ch. 4.2 - The survey in Example 5 found that 27% of U.S....Ch. 4.2 - About 5% of workers (ages 16 years and older) in...Ch. 4.2 - A recent study found that 28% of U.S. adults read...Ch. 4.2 - In San Francisco, California, about 44% of the...Ch. 4.2 - In a binomial experiment, what does it mean to say...Ch. 4.2 - In a binomial experiment with n trials, what does...Ch. 4.2 - Graphical Analysis In Exercises 35, the histogram...Ch. 4.2 - Graphical Analysis In Exercises 35, the histogram...Ch. 4.2 - Graphical Analysis In Exercises 35, the histogram...Ch. 4.2 - Graphical Analysis In Exercises 68, the histogram...Ch. 4.2 - Graphical Analysis In Exercises 68, the histogram...Ch. 4.2 - Graphical Analysis In Exercises 68, the histogram...Ch. 4.2 - Identify the unusual values of x in each histogram...Ch. 4.2 - Identify the unusual values of x in each histogram...Ch. 4.2 - Mean, Variance, and Standard Deviation In...Ch. 4.2 - Mean, Variance, and Standard Deviation In...Ch. 4.2 - Mean, Variance, and Standard Deviation In...Ch. 4.2 - Mean, Variance, and Standard Deviation In...Ch. 4.2 - Identifying and Understanding Binomial Experiments...Ch. 4.2 - Identifying and Understanding Binomial Experiments...Ch. 4.2 - Identifying and Understanding Binomial Experiments...Ch. 4.2 - Identifying and Understanding Binomial Experiments...Ch. 4.2 - Finding Binomial Probabilities In Exercises 1926,...Ch. 4.2 - Finding Binomial Probabilities In Exercises 1926,...Ch. 4.2 - Finding Binomial Probabilities In Exercises 1926,...Ch. 4.2 - Finding Binomial Probabilities In Exercises 1926,...Ch. 4.2 - Finding Binomial Probabilities In Exercises 1926,...Ch. 4.2 - Finding Binomial Probabilities In Exercises 1926,...Ch. 4.2 - Finding Binomial Probabilities In Exercises 1926,...Ch. 4.2 - Finding Binomial Probabilities In Exercises 1926,...Ch. 4.2 - Constructing and Graphing Binomial Distributions...Ch. 4.2 - Constructing and Graphing Binomial Distributions...Ch. 4.2 - Constructing and Graphing Binomial Distributions...Ch. 4.2 - Constructing and Graphing Binomial Distributions...Ch. 4.2 - Finding and Interpreting Mean, Variance, and...Ch. 4.2 - Finding and Interpreting Mean, Variance, and...Ch. 4.2 - Finding and Interpreting Mean, Variance, and...Ch. 4.2 - Finding and Interpreting Mean, Variance, and...Ch. 4.2 - Finding and Interpreting Mean, Variance, and...Ch. 4.2 - Finding and Interpreting Mean, Variance, and...Ch. 4.2 - Genetics According to a theory in genetics, when...Ch. 4.2 - Genetics Another proposed theory in genetics gives...Ch. 4.2 - Manufacturing An assembly line produces 10,000...Ch. 4.2 - Prob. 1ACh. 4.2 - Prob. 2ACh. 4.2 - For the election in Exercise 1, simulate selecting...Ch. 4.2 - 1. Construct a probability distribution for the...Ch. 4.2 - 2. Construct binomial probability distributions...Ch. 4.2 - 3. Compare your distributions from Exercise 1 and...Ch. 4.2 - 4. During the 2016 regular season, Kris Bryant of...Ch. 4.3 - The study in Example 1 found that the smartphones...Ch. 4.3 - What is the probability that more than four...Ch. 4.3 - Two thousand brown trout are introduced into a...Ch. 4.3 - In Exercises 14, find the indicated probability...Ch. 4.3 - Prob. 2ECh. 4.3 - In Exercises 14, find the indicated probability...Ch. 4.3 - Prob. 4ECh. 4.3 - In Exercises 58, find the indicated probability...Ch. 4.3 - Prob. 6ECh. 4.3 - In Exercises 58, find the indicated probability...Ch. 4.3 - In Exercises 58, find the indicated probability...Ch. 4.3 - Prob. 9ECh. 4.3 - In your own words, describe the difference between...Ch. 4.3 - Prob. 11ECh. 4.3 - Using a Distribution to Find Probabilities In...Ch. 4.3 - Using a Distribution to Find Probabilities In...Ch. 4.3 - Using a Distribution to Find Probabilities In...Ch. 4.3 - Using a Distribution to Find Probabilities In...Ch. 4.3 - Using a Distribution to Find Probabilities In...Ch. 4.3 - Using a Distribution to Find Probabilities In...Ch. 4.3 - Using a Distribution to Find Probabilities In...Ch. 4.3 - Using a Distribution to Find Probabilities In...Ch. 4.3 - Using a Distribution to Find Probabilities In...Ch. 4.3 - Using a Distribution to Find Probabilities In...Ch. 4.3 - Using a Distribution to Find Probabilities In...Ch. 4.3 - Using a Distribution to Find Probabilities In...Ch. 4.3 - Using a Distribution to Find Probabilities In...Ch. 4.3 - Using a Distribution to Find Probabilities In...Ch. 4.3 - Using a Distribution to Find Probabilities In...Ch. 4.3 - Comparing Binomial and Poisson Distributions An...Ch. 4.3 - Hypergeometric Distribution Binomial experiments...Ch. 4.3 - Geometric Distribution: Mean and Variance In...Ch. 4.3 - Geometric Distribution: Mean and Variance In...Ch. 4.3 - Prob. 31ECh. 4.3 - Geometric Distribution: Mean and Variance In...Ch. 4 - In Exercises 13, assume the fire department...Ch. 4 - In Exercises 13, assume the fire department...Ch. 4 - In Exercises 13, assume the fire department...Ch. 4 - In Exercises 1 and 2, determine whether the random...Ch. 4 - In Exercises 1 and 2, determine whether the random...Ch. 4 - In Exercises 3 and 4, (a) construct a probability...Ch. 4 - In Exercises 3 and 4, (a) construct a probability...Ch. 4 - In Exercises 5 and 6, determine whether the...Ch. 4 - In Exercises 5 and 6, determine whether the...Ch. 4 - In Exercises 7 and 8, (a) find the mean, variance,...Ch. 4 - In Exercises 7 and 8, (a) find the mean, variance,...Ch. 4 - In Exercises 9 and 10, find the expected net gain...Ch. 4 - In Exercises 9 and 10, find the expected net gain...Ch. 4 - In Exercises 11 and 12, determine whether the...Ch. 4 - In Exercises 11 and 12, determine whether the...Ch. 4 - In Exercises 1316, find the indicated binomial...Ch. 4 - In Exercises 1316, find the indicated binomial...Ch. 4 - In Exercises 1316, find the indicated binomial...Ch. 4 - In Exercises 1316, find the indicated binomial...Ch. 4 - In Exercises 17 and 18, (a) construct a binomial...Ch. 4 - In Exercises 17 and 18, (a) construct a binomial...Ch. 4 - In Exercises 19 and 20, find the mean, variance,...Ch. 4 - In Exercises 19 and 20, find the mean, variance,...Ch. 4 - In Exercises 2126, find the indicated...Ch. 4 - Prob. 4.3.22RECh. 4 - In Exercises 2126, find the indicated...Ch. 4 - Prob. 4.3.24RECh. 4 - Prob. 4.3.25RECh. 4 - In Exercises 2126, find the indicated...Ch. 4 - Determine whether the random variable x is...Ch. 4 - The table lists the number of wireless devices per...Ch. 4 - Prob. 3CQCh. 4 - The five-year success rate of kidney transplant...Ch. 4 - An online magazine finds that the mean number of...Ch. 4 - Basketball player Dwight Howard makes a free throw...Ch. 4 - Which event(s) in Exercise 6 can be considered...Ch. 4 - In Exercises 13find the indicated probabilities...Ch. 4 - In Exercises 13, find the indicated probabilities...Ch. 4 - In Exercises 13find the indicated probabilities...Ch. 4 - Determine whether the distribution is a...Ch. 4 - The table shows the ages of students in a freshman...Ch. 4 - Seventy-seven percent of U.S. college students pay...Ch. 4 - The Centers for Disease Control and Prevention...Ch. 4 - The Centers for Disease Control and Prevention...Ch. 4 - Suspicious Samples? A lab worker tells you that...Ch. 4 - In Exercises 17, consider a grocery store that can...Ch. 4 - In Exercises 17, consider a grocery store that can...Ch. 4 - Prob. 3TCh. 4 - Prob. 4TCh. 4 - Prob. 5TCh. 4 - In Exercises 17, consider a grocery store that can...Ch. 4 - In Exercises 17, consider a grocery store that can...
Knowledge Booster


Learn more about
Need a deep-dive on the concept behind this application? Look no further. Learn more about this topic, statistics and related others by exploring similar questions and additional content below.Similar questions
- Suppose that the chance that an elementary student eats hot lunch is 30 percent. What’s the chance that, among 20 randomly selected students, between 6 and 8 students eat hot lunch (inclusive)?arrow_forwardBob’s commuting times to work are varied. He makes it to work on time 80 percent of the time. On 12 randomly selected trips to work, what’s the chance that Bob makes it on time at least 10 times?arrow_forwardYour chance of winning a small prize in a scratch-off ticket is 10 percent. You buy five tickets. What’s the chance you will win at least one prize?arrow_forward
- Suppose that 60 percent of families own a pet. You randomly sample four families. What is the chance that two or three of them own a pet?arrow_forwardIf 40 percent of university students purchase their textbooks online, in a random sample of five students, what’s the chance that exactly one of them purchased their textbooks online?arrow_forwardA stoplight is green 40 percent of the time. If you stop at this light eight random times, what is the chance that it’s green exactly five times?arrow_forward
- If 10 percent of the parts made by a certain company are defective and have to be remade, what is the chance that a random sample of four parts has one that is defective?arrow_forwardQuestion 4 Fourteen individuals were given a complex puzzle to complete. The times in seconds was recorded for their first and second attempts and the results provided below: 1 2 3 first attempt 172 255 second attempt 70 4 5 114 248 218 194 270 267 66 6 7 230 219 341 174 8 10 9 210 261 347 218 200 281 199 308 268 243 236 300 11 12 13 14 140 302 a. Calculate a 95% confidence interval for the mean time taken by each individual to complete the (i) first attempt and (ii) second attempt. [la] b. Test the hypothesis that the difference between the two mean times for both is 100 seconds. Use the 5% level of significance. c. Subsequently, it was learnt that the times for the second attempt were incorrecly recorded and that each of the values is 50 seconds too large. What, if any, difference does this make to the results of the test done in part (b)? Show all steps for the hypothesis testarrow_forwardQuestion 3 3200 students were asked about the importance of study groups in successfully completing their courses. They were asked to provide their current majors as well as their opinion. The results are given below: Major Opinion Psychology Sociology Economics Statistics Accounting Total Agree 144 183 201 271 251 1050 Disagree 230 233 254 227 218 1162 Impartial 201 181 196 234 176 988 Total 575 597 651 732 645 3200 a. State both the null and alternative hypotheses. b. Provide the decision rule for making this decision. Use an alpha level of 5%. c. Show all of the work necessary to calculate the appropriate statistic. | d. What conclusion are you allowed to draw? c. Would your conclusion change at the 10% level of significance? f. Confirm test results in part (c) using JASP. Note: All JASP input files and output tables should be providedarrow_forward
- Question 1 A tech company has acknowledged the importance of having records of all meetings conducted. The meetings are very fast paced and requires equipment that is able to capture the information in the shortest possible time. There are two options, using a typewriter or a word processor. Fifteen administrative assistants are selected and the amount of typing time in hours was recorded. The results are given below: 1 2 3 4 5 6 7 8 9 10 11 12 13 14 15 typewriter 8.0 6.5 5.0 6.7 7.8 8.5 7.2 5.7 9.2 5.7 6.5 word processor 7.2 5.7 8.3 7.5 9.2 7.2 6.5 7.0 6.9 34 7.0 6.9 8.8 6.7 8.8 9.4 8.6 5.5 7.2 8.4 a. Test the hypothesis that the mean typing time in hours for typewriters is less than 7.0. Use the 1% level of significance. b. Construct a 90% confidence interval for the difference in mean typing time in hours, where a difference is equal to the typing time in hours of word processors minus typing time in hours of typewriter. c. Using the 5% significance level, determine whether there is…arrow_forwardIllustrate 2/7×4/5 using a rectangular region. Explain your work. arrow_forwardWrite three other different proportions equivalent to the following using the same values as in the given proportion 3 foot over 1 yard equals X feet over 5 yardsarrow_forward
arrow_back_ios
SEE MORE QUESTIONS
arrow_forward_ios
Recommended textbooks for you
 Big Ideas Math A Bridge To Success Algebra 1: Stu...AlgebraISBN:9781680331141Author:HOUGHTON MIFFLIN HARCOURTPublisher:Houghton Mifflin Harcourt
 Holt Mcdougal Larson Pre-algebra: Student Edition...AlgebraISBN:9780547587776Author:HOLT MCDOUGALPublisher:HOLT MCDOUGAL
 Glencoe Algebra 1, Student Edition, 9780079039897...AlgebraISBN:9780079039897Author:CarterPublisher:McGraw Hill
 College AlgebraAlgebraISBN:9781305115545Author:James Stewart, Lothar Redlin, Saleem WatsonPublisher:Cengage Learning
 Algebra: Structure And Method, Book 1AlgebraISBN:9780395977224Author:Richard G. Brown, Mary P. Dolciani, Robert H. Sorgenfrey, William L. ColePublisher:McDougal Littell
Big Ideas Math A Bridge To Success Algebra 1: Stu...
Algebra
ISBN:9781680331141
Author:HOUGHTON MIFFLIN HARCOURT
Publisher:Houghton Mifflin Harcourt
Holt Mcdougal Larson Pre-algebra: Student Edition...
Algebra
ISBN:9780547587776
Author:HOLT MCDOUGAL
Publisher:HOLT MCDOUGAL
Glencoe Algebra 1, Student Edition, 9780079039897...
Algebra
ISBN:9780079039897
Author:Carter
Publisher:McGraw Hill
College Algebra
Algebra
ISBN:9781305115545
Author:James Stewart, Lothar Redlin, Saleem Watson
Publisher:Cengage Learning
Algebra: Structure And Method, Book 1
Algebra
ISBN:9780395977224
Author:Richard G. Brown, Mary P. Dolciani, Robert H. Sorgenfrey, William L. Cole
Publisher:McDougal Littell
The Shape of Data: Distributions: Crash Course Statistics #7; Author: CrashCourse;https://www.youtube.com/watch?v=bPFNxD3Yg6U;License: Standard YouTube License, CC-BY
Shape, Center, and Spread - Module 20.2 (Part 1); Author: Mrmathblog;https://www.youtube.com/watch?v=COaid7O_Gag;License: Standard YouTube License, CC-BY
Shape, Center and Spread; Author: Emily Murdock;https://www.youtube.com/watch?v=_YyW0DSCzpM;License: Standard Youtube License