Elementary Statistics: Picturing the World Books a la carte Plus MyLab Statistics with Pearson eText -- Access Card Package (7th Edition)
7th Edition
ISBN: 9780134685205
Author: Ron Larson, Betsy Farber
Publisher: PEARSON
expand_more
expand_more
format_list_bulleted
Concept explainers
Videos
Textbook Question
thumb_up100%
Chapter 4.1, Problem 22E
Finding Probabilities Use the
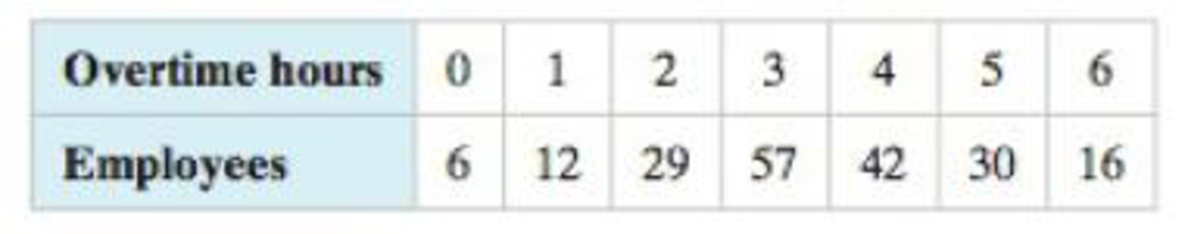
20. Overtime Hours The number of overtime hours worked in one week per employee
Expert Solution & Answer
Want to see the full answer?
Check out a sample textbook solution
Students have asked these similar questions
A horse trainer teaches horses to jump by using two methods of instruction. Horses being taught by method A have a lead horse that accompanies each jump. Horses being taught by method B have no lead horse. The table shows the number of training sessions required before each horse performed the jumps properly.
Method A
25
23
39
29
37
20
Method B
41
21
46
42
24
44
Method A
45
35
27
31
34
49
Method B
26
43
47
32
40
Use a rank-sum test with a5% level of significance to test the claim that there is no difference between the training sessions distributions. If the value of the sample test statistic R, the rank-sum, is 150, calculate the P-value. Round your answer to four decimal places.
A data processing company has a training program for new salespeople. After completing the training program, each trainee is ranked by his or her instructor. After a year of sales, the same class of trainees is again ranked by a company supervisor according to net value of the contracts they have acquired for the company. The results for a random sample of 11 salespeople trained in the last year follow, where x is rank in training class and y is rank in sales after 1 year. Lower ranks mean higher standing in class and higher net sales.
Person
1
2
3
4
5
6
x rank
8
11
2
4
5
3
y rank
7
10
1
3
2
4
Person
7
8
9
10
11
x rank
7
9
10
1
6
y rank
8
11
9
6
5
Using a 1% level of significance, test the claim that the relation between x and y is monotone (either increasing or decreasing). Verify that the Spearman rank correlation coefficient . This implies that the P-value lies between 0.002 and 0.01. State…
Sand and clay studies were conducted at a site in California. Twelve consecutive depths, each about 15 cm deep, were studied and the following percentages of sand in the soil were recorded.
34.4
27.1
30.8
28.0
32.2
27.6
32.8
25.2
31.4
33.5
24.7
28.4
Converting this sequence of numbers to a sequence of symbols A and B, where A indicates a value above the median and B denotes a value below the median gives ABABABABAABB. Test the sequence for randomness about the median with a 5% level of significance. Verify that the number of runs is 10. What is the upper critical value c2?
Chapter 4 Solutions
Elementary Statistics: Picturing the World Books a la carte Plus MyLab Statistics with Pearson eText -- Access Card Package (7th Edition)
Ch. 4.1 - Determine whether each random variable x is...Ch. 4.1 - A company tracks the number of sales new employees...Ch. 4.1 - Verify that the distribution you constructed in...Ch. 4.1 - Determine whether each distribution is a...Ch. 4.1 - Find the mean of the probability distribution you...Ch. 4.1 - Find the variance and standard deviation of the...Ch. 4.1 - At a raffle, 2000 tickets are sold at 5 each for...Ch. 4.1 - What is a random variable? Give an example of a...Ch. 4.1 - What is a discrete probability distribution? What...Ch. 4.1 - Is the expected value of the probability...
Ch. 4.1 - What does the mean of a probability distribution...Ch. 4.1 - True or False? In Exercises 58, determine whether...Ch. 4.1 - True or False? In Exercises 58, determine whether...Ch. 4.1 - True or False? In Exercises 58, determine whether...Ch. 4.1 - True or False? In Exercises 58, determine whether...Ch. 4.1 - Graphical Analysis In Exercises 912, determine...Ch. 4.1 - Graphical Analysis In Exercises 912, determine...Ch. 4.1 - Graphical Analysis In Exercises 912, determine...Ch. 4.1 - Graphical Analysis In Exercises 912, determine...Ch. 4.1 - Discrete Variables and Continuous Variables In...Ch. 4.1 - Discrete Variables and Continuous Variables In...Ch. 4.1 - Discrete Variables and Continuous Variables In...Ch. 4.1 - Discrete Variables and Continuous Variables In...Ch. 4.1 - Discrete Variables and Continuous Variables In...Ch. 4.1 - Discrete Variables and Continuous Variables In...Ch. 4.1 - Constructing and Graphing Discrete Probability...Ch. 4.1 - Constructing and Graphing Discrete Probability...Ch. 4.1 - Finding Probabilities Use the probability...Ch. 4.1 - Finding Probabilities Use the probability...Ch. 4.1 - Unusual Events In Exercise 19, would it be unusual...Ch. 4.1 - Unusual Events In Exercise 20, would it be unusual...Ch. 4.1 - Determining a Missing Probability In Exercises 25...Ch. 4.1 - Determining a Missing Probability In Exercises 25...Ch. 4.1 - Identifying Probability Distributions In Exercises...Ch. 4.1 - Identifying Probability Distributions In Exercises...Ch. 4.1 - Finding the Mean, Variance, and Standard Deviation...Ch. 4.1 - Baseball The number of games played in each World...Ch. 4.1 - Finding the Mean, Variance, and Standard Deviation...Ch. 4.1 - Finding the Mean, Variance, and Standard Deviation...Ch. 4.1 - Hurricanes The histogram shows the distribution of...Ch. 4.1 - Reviewer Ratings The histogram shows the reviewer...Ch. 4.1 - Writing The expected value of an accountants...Ch. 4.1 - Writing In a game of chance, what is the...Ch. 4.1 - Finding an Expected Value In Exercises 37and 38,...Ch. 4.1 - A high school basketball team is selling 10 raffle...Ch. 4.1 - Linear Transformation of a Random Variable In...Ch. 4.1 - Prob. 40ECh. 4.1 - What is the average sum of their scores? What is...Ch. 4.1 - What is the standard deviation of the difference...Ch. 4.2 - Determine whether the experiment is a binomial...Ch. 4.2 - A card is selected from a standard deck and...Ch. 4.2 - A survey found that 52% of U.S. adults associate...Ch. 4.2 - The survey in Example 5 found that 27% of U.S....Ch. 4.2 - About 5% of workers (ages 16 years and older) in...Ch. 4.2 - A recent study found that 28% of U.S. adults read...Ch. 4.2 - In San Francisco, California, about 44% of the...Ch. 4.2 - In a binomial experiment, what does it mean to say...Ch. 4.2 - In a binomial experiment with n trials, what does...Ch. 4.2 - Graphical Analysis In Exercises 35, the histogram...Ch. 4.2 - Graphical Analysis In Exercises 35, the histogram...Ch. 4.2 - Graphical Analysis In Exercises 35, the histogram...Ch. 4.2 - Graphical Analysis In Exercises 68, the histogram...Ch. 4.2 - Graphical Analysis In Exercises 68, the histogram...Ch. 4.2 - Graphical Analysis In Exercises 68, the histogram...Ch. 4.2 - Identify the unusual values of x in each histogram...Ch. 4.2 - Identify the unusual values of x in each histogram...Ch. 4.2 - Mean, Variance, and Standard Deviation In...Ch. 4.2 - Mean, Variance, and Standard Deviation In...Ch. 4.2 - Mean, Variance, and Standard Deviation In...Ch. 4.2 - Mean, Variance, and Standard Deviation In...Ch. 4.2 - Identifying and Understanding Binomial Experiments...Ch. 4.2 - Identifying and Understanding Binomial Experiments...Ch. 4.2 - Identifying and Understanding Binomial Experiments...Ch. 4.2 - Identifying and Understanding Binomial Experiments...Ch. 4.2 - Finding Binomial Probabilities In Exercises 1926,...Ch. 4.2 - Finding Binomial Probabilities In Exercises 1926,...Ch. 4.2 - Finding Binomial Probabilities In Exercises 1926,...Ch. 4.2 - Finding Binomial Probabilities In Exercises 1926,...Ch. 4.2 - Finding Binomial Probabilities In Exercises 1926,...Ch. 4.2 - Finding Binomial Probabilities In Exercises 1926,...Ch. 4.2 - Finding Binomial Probabilities In Exercises 1926,...Ch. 4.2 - Finding Binomial Probabilities In Exercises 1926,...Ch. 4.2 - Constructing and Graphing Binomial Distributions...Ch. 4.2 - Constructing and Graphing Binomial Distributions...Ch. 4.2 - Constructing and Graphing Binomial Distributions...Ch. 4.2 - Constructing and Graphing Binomial Distributions...Ch. 4.2 - Finding and Interpreting Mean, Variance, and...Ch. 4.2 - Finding and Interpreting Mean, Variance, and...Ch. 4.2 - Finding and Interpreting Mean, Variance, and...Ch. 4.2 - Finding and Interpreting Mean, Variance, and...Ch. 4.2 - Finding and Interpreting Mean, Variance, and...Ch. 4.2 - Finding and Interpreting Mean, Variance, and...Ch. 4.2 - Genetics According to a theory in genetics, when...Ch. 4.2 - Genetics Another proposed theory in genetics gives...Ch. 4.2 - Manufacturing An assembly line produces 10,000...Ch. 4.2 - Prob. 1ACh. 4.2 - Prob. 2ACh. 4.2 - For the election in Exercise 1, simulate selecting...Ch. 4.2 - 1. Construct a probability distribution for the...Ch. 4.2 - 2. Construct binomial probability distributions...Ch. 4.2 - 3. Compare your distributions from Exercise 1 and...Ch. 4.2 - 4. During the 2016 regular season, Kris Bryant of...Ch. 4.3 - The study in Example 1 found that the smartphones...Ch. 4.3 - What is the probability that more than four...Ch. 4.3 - Two thousand brown trout are introduced into a...Ch. 4.3 - In Exercises 14, find the indicated probability...Ch. 4.3 - Prob. 2ECh. 4.3 - In Exercises 14, find the indicated probability...Ch. 4.3 - Prob. 4ECh. 4.3 - In Exercises 58, find the indicated probability...Ch. 4.3 - Prob. 6ECh. 4.3 - In Exercises 58, find the indicated probability...Ch. 4.3 - In Exercises 58, find the indicated probability...Ch. 4.3 - Prob. 9ECh. 4.3 - In your own words, describe the difference between...Ch. 4.3 - Prob. 11ECh. 4.3 - Using a Distribution to Find Probabilities In...Ch. 4.3 - Using a Distribution to Find Probabilities In...Ch. 4.3 - Using a Distribution to Find Probabilities In...Ch. 4.3 - Using a Distribution to Find Probabilities In...Ch. 4.3 - Using a Distribution to Find Probabilities In...Ch. 4.3 - Using a Distribution to Find Probabilities In...Ch. 4.3 - Using a Distribution to Find Probabilities In...Ch. 4.3 - Using a Distribution to Find Probabilities In...Ch. 4.3 - Using a Distribution to Find Probabilities In...Ch. 4.3 - Using a Distribution to Find Probabilities In...Ch. 4.3 - Using a Distribution to Find Probabilities In...Ch. 4.3 - Using a Distribution to Find Probabilities In...Ch. 4.3 - Using a Distribution to Find Probabilities In...Ch. 4.3 - Using a Distribution to Find Probabilities In...Ch. 4.3 - Using a Distribution to Find Probabilities In...Ch. 4.3 - Comparing Binomial and Poisson Distributions An...Ch. 4.3 - Hypergeometric Distribution Binomial experiments...Ch. 4.3 - Geometric Distribution: Mean and Variance In...Ch. 4.3 - Geometric Distribution: Mean and Variance In...Ch. 4.3 - Prob. 31ECh. 4.3 - Geometric Distribution: Mean and Variance In...Ch. 4 - In Exercises 13, assume the fire department...Ch. 4 - In Exercises 13, assume the fire department...Ch. 4 - In Exercises 13, assume the fire department...Ch. 4 - In Exercises 1 and 2, determine whether the random...Ch. 4 - In Exercises 1 and 2, determine whether the random...Ch. 4 - In Exercises 3 and 4, (a) construct a probability...Ch. 4 - In Exercises 3 and 4, (a) construct a probability...Ch. 4 - In Exercises 5 and 6, determine whether the...Ch. 4 - In Exercises 5 and 6, determine whether the...Ch. 4 - In Exercises 7 and 8, (a) find the mean, variance,...Ch. 4 - In Exercises 7 and 8, (a) find the mean, variance,...Ch. 4 - In Exercises 9 and 10, find the expected net gain...Ch. 4 - In Exercises 9 and 10, find the expected net gain...Ch. 4 - In Exercises 11 and 12, determine whether the...Ch. 4 - In Exercises 11 and 12, determine whether the...Ch. 4 - In Exercises 1316, find the indicated binomial...Ch. 4 - In Exercises 1316, find the indicated binomial...Ch. 4 - In Exercises 1316, find the indicated binomial...Ch. 4 - In Exercises 1316, find the indicated binomial...Ch. 4 - In Exercises 17 and 18, (a) construct a binomial...Ch. 4 - In Exercises 17 and 18, (a) construct a binomial...Ch. 4 - In Exercises 19 and 20, find the mean, variance,...Ch. 4 - In Exercises 19 and 20, find the mean, variance,...Ch. 4 - In Exercises 2126, find the indicated...Ch. 4 - Prob. 4.3.22RECh. 4 - In Exercises 2126, find the indicated...Ch. 4 - Prob. 4.3.24RECh. 4 - Prob. 4.3.25RECh. 4 - In Exercises 2126, find the indicated...Ch. 4 - Determine whether the random variable x is...Ch. 4 - The table lists the number of wireless devices per...Ch. 4 - Prob. 3CQCh. 4 - The five-year success rate of kidney transplant...Ch. 4 - An online magazine finds that the mean number of...Ch. 4 - Basketball player Dwight Howard makes a free throw...Ch. 4 - Which event(s) in Exercise 6 can be considered...Ch. 4 - In Exercises 13find the indicated probabilities...Ch. 4 - In Exercises 13, find the indicated probabilities...Ch. 4 - In Exercises 13find the indicated probabilities...Ch. 4 - Determine whether the distribution is a...Ch. 4 - The table shows the ages of students in a freshman...Ch. 4 - Seventy-seven percent of U.S. college students pay...Ch. 4 - The Centers for Disease Control and Prevention...Ch. 4 - The Centers for Disease Control and Prevention...Ch. 4 - Suspicious Samples? A lab worker tells you that...Ch. 4 - In Exercises 17, consider a grocery store that can...Ch. 4 - In Exercises 17, consider a grocery store that can...Ch. 4 - Prob. 3TCh. 4 - Prob. 4TCh. 4 - Prob. 5TCh. 4 - In Exercises 17, consider a grocery store that can...Ch. 4 - In Exercises 17, consider a grocery store that can...
Knowledge Booster


Learn more about
Need a deep-dive on the concept behind this application? Look no further. Learn more about this topic, statistics and related others by exploring similar questions and additional content below.Similar questions
- Sand and clay studies were conducted at a site in California. Twelve consecutive depths, each about 15 cm deep, were studied and the following percentages of sand in the soil were recorded. 34.4 27.1 30.8 28.0 32.2 27.6 32.8 25.2 31.4 33.5 24.7 28.4 Converting this sequence of numbers to a sequence of symbols A and B, where A indicates a value above the median and B denotes a value below the median gives ABABABABAABB. Test the sequence for randomness about the median with a 5% level of significance. Verify that the number of runs is 10. What is the upper critical value c2?arrow_forward29% of all college students major in STEM (Science, Technology, Engineering, and Math). If 46 college students are randomly selected, find the probability thata. Exactly 11 of them major in STEM. b. At most 12 of them major in STEM. c. At least 11 of them major in STEM. d. Between 11 and 15 (including 11 and 15) of them major in STEM.arrow_forwardSand and clay studies were conducted at a site in California. Twelve consecutive depths, each about 15 cm deep, were studied and the following percentages of sand in the soil were recorded. 27.3 34.6 30.6 27.8 33.4 31.5 27.3 31.2 32.0 24.7 24.4 28.2 Test this sequence for randomness about the median. Converting this sequence of numbers to a sequence of symbols A and B, where A indicates a value above the median and B denotes a value below the median gives BAABAABAABBB. Verify that the number of runs is 7, the lower critical number is 3, and the upper critical number is 11. Use a 5% level of significance. State the conclusion of the test and interpret your results.arrow_forward
- 29% of all college students major in STEM (Science, Technology, Engineering, and Math). If 46 college students are randomly selected, find the probability thata. Exactly 11 of them major in STEM. b. At most 12 of them major in STEM. c. At least 11 of them major in STEM. d. Between 11 and 15 (including 11 and 15) of them major in STEM.arrow_forwardPlease solving problem2 Problem1 We consider a two-period binomial model with the following properties: each period lastsone (1) year and the current stock price is S0 = 4. On each period, the stock price doubleswhen it moves up and is reduced by half when it moves down. The annual interest rateon the money market is 25%. (This model is the same as in Prob. 1 of HW#2).We consider four options on this market: A European call option with maturity T = 2 years and strike price K = 5; A European put option with maturity T = 2 years and strike price K = 5; An American call option with maturity T = 2 years and strike price K = 5; An American put option with maturity T = 2 years and strike price K = 5.(a) Find the price at time 0 of both European options.(b) Find the price at time 0 of both American options. Compare your results with (a)and comment.(c) For each of the American options, describe the optimal exercising strategy.arrow_forwardProblem 1.We consider a two-period binomial model with the following properties: each period lastsone (1) year and the current stock price is S0 = 4. On each period, the stock price doubleswhen it moves up and is reduced by half when it moves down. The annual interest rateon the money market is 25%. We consider four options on this market: A European call option with maturity T = 2 years and strike price K = 5; A European put option with maturity T = 2 years and strike price K = 5; An American call option with maturity T = 2 years and strike price K = 5; An American put option with maturity T = 2 years and strike price K = 5.(a) Find the price at time 0 of both European options.(b) Find the price at time 0 of both American options. Compare your results with (a)and comment.(c) For each of the American options, describe the optimal exercising strategy.(d) We assume that you sell the American put to a market participant A for the pricefound in (b). Explain how you act on the market…arrow_forward
- What is the standard scores associated to the left of z is 0.1446arrow_forwardNote: The purpose of this problem below is to use computational techniques (Excelspreadsheet, Matlab, R, Python, etc.) and code the dynamic programming ideas seen inclass. Please provide the numerical answer to the questions as well as a sample of yourwork (spreadsheet, code file, etc.).We consider an N-period binomial model with the following properties: N = 60, thecurrent stock price is S0 = 1000; on each period, the stock price increases by 0.5% whenit moves up and decreases by 0.3% when it moves down. The annual interest rate on themoney market is 5%. (Notice that this model is a CRR model, which means that thebinomial tree is recombining.)(a) Find the price at time t0 = 0 of a (European) call option with strike price K = 1040and maturity T = 1 year.(b) Find the price at time t0 = 0 of a (European) put option with strike price K = 1040and maturity T = 1 year.(c) We consider now, that you are at time t5 (i.e. after 5 periods, which represents 1month later). Assume that the stock…arrow_forwardshow work in paperarrow_forward
- show all work (...or what you entered into your calculator...)arrow_forwardanswerarrow_forwardQuestion 2 The data below provides the battery life of thirty eight (38) motorcycle batteries. 100 83 83 105 110 81 114 99 101 105 78 115 74 96 106 89 94 81 106 91 93 86 79 103 94 108 113 100 117 120 77 93 93 85 76 89 78 88 680 a. Test the hypothesis that mean battery life is greater than 90. Use the 1% level of significance. b. Determine if the mean battery life is different from 80. Use the 10% level of significance. Show all steps for the hypothesis test c. Would your conlcusion in part (b) change at the 5% level of significance? | d. Confirm test results in part (b) using JASP. Note: All JASP input files and output tables should be providedarrow_forward
arrow_back_ios
SEE MORE QUESTIONS
arrow_forward_ios
Recommended textbooks for you
 College AlgebraAlgebraISBN:9781305115545Author:James Stewart, Lothar Redlin, Saleem WatsonPublisher:Cengage Learning
 Algebra and Trigonometry (MindTap Course List)AlgebraISBN:9781305071742Author:James Stewart, Lothar Redlin, Saleem WatsonPublisher:Cengage Learning
 Algebra & Trigonometry with Analytic GeometryAlgebraISBN:9781133382119Author:SwokowskiPublisher:Cengage
 Holt Mcdougal Larson Pre-algebra: Student Edition...AlgebraISBN:9780547587776Author:HOLT MCDOUGALPublisher:HOLT MCDOUGAL
 College Algebra (MindTap Course List)AlgebraISBN:9781305652231Author:R. David Gustafson, Jeff HughesPublisher:Cengage Learning
College Algebra
Algebra
ISBN:9781305115545
Author:James Stewart, Lothar Redlin, Saleem Watson
Publisher:Cengage Learning
Algebra and Trigonometry (MindTap Course List)
Algebra
ISBN:9781305071742
Author:James Stewart, Lothar Redlin, Saleem Watson
Publisher:Cengage Learning
Algebra & Trigonometry with Analytic Geometry
Algebra
ISBN:9781133382119
Author:Swokowski
Publisher:Cengage
Holt Mcdougal Larson Pre-algebra: Student Edition...
Algebra
ISBN:9780547587776
Author:HOLT MCDOUGAL
Publisher:HOLT MCDOUGAL
College Algebra (MindTap Course List)
Algebra
ISBN:9781305652231
Author:R. David Gustafson, Jeff Hughes
Publisher:Cengage Learning
Mod-01 Lec-01 Discrete probability distributions (Part 1); Author: nptelhrd;https://www.youtube.com/watch?v=6x1pL9Yov1k;License: Standard YouTube License, CC-BY
Discrete Probability Distributions; Author: Learn Something;https://www.youtube.com/watch?v=m9U4UelWLFs;License: Standard YouTube License, CC-BY
Probability Distribution Functions (PMF, PDF, CDF); Author: zedstatistics;https://www.youtube.com/watch?v=YXLVjCKVP7U;License: Standard YouTube License, CC-BY
Discrete Distributions: Binomial, Poisson and Hypergeometric | Statistics for Data Science; Author: Dr. Bharatendra Rai;https://www.youtube.com/watch?v=lHhyy4JMigg;License: Standard Youtube License