
Fundamentals of Statistics Plus MyLab Statistics with Pearson eText - Title-Specific Access Card Package (5th Edition)
5th Edition
ISBN: 9780134763729
Author: Michael Sullivan III
Publisher: PEARSON
expand_more
expand_more
format_list_bulleted
Videos
Textbook Question
Chapter 4.2, Problem 22AYU
Hurricanes (Refer to Problem 30, Section 4.1) The following data represent the maximum wind speed (in knots) and atmospheric pressure (in millibars) for a random sample of hurricanes that originated in the Atlantic Ocean.
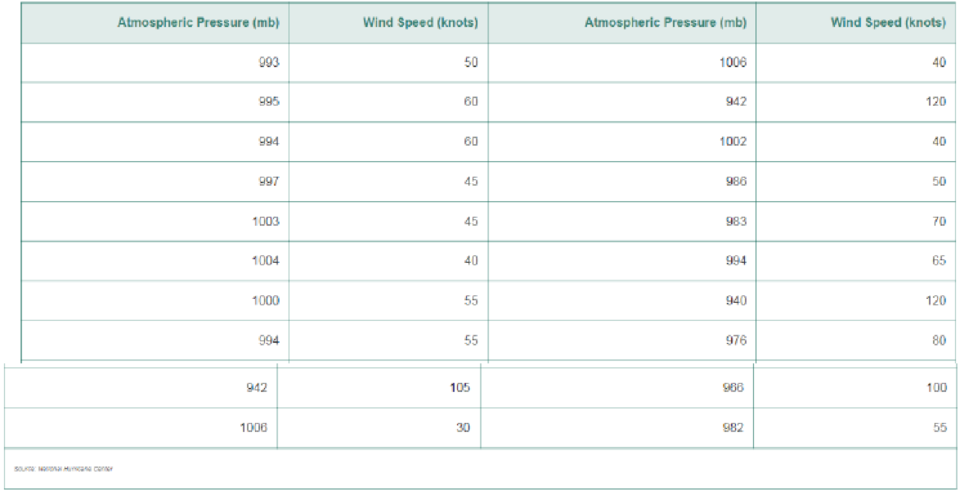
- a. Find the least-squares regression line treating atmospheric pressure as the explanatory variable.
- b. Interpret the slope.
- c. Is it reasonable to interpret the y-intercept? Why?
- d. One hurricane had an atmospheric pressure of 997 mb. Is this hurricane’s wind speed above or below average for a hurricane with this level of atmospheric pressure?
Expert Solution & Answer
Want to see the full answer?
Check out a sample textbook solution
Students have asked these similar questions
30. An individual who has automobile insurance from a certain company is randomly selected. Let Y be the num- ber of moving violations for which the individual was cited during the last 3 years. The pmf of Y isy | 1 2 4 8 16p(y) | .05 .10 .35 .40 .10
a.Compute E(Y).b. Suppose an individual with Y violations incurs a surcharge of $100Y^2. Calculate the expected amount of the surcharge.
24. An insurance company offers its policyholders a num- ber of different premium payment options. For a ran- domly selected policyholder, let X = the number of months between successive payments. The cdf of X is as follows:
F(x)=0.00 : x < 10.30 : 1≤x<30.40 : 3≤ x < 40.45 : 4≤ x <60.60 : 6≤ x < 121.00 : 12≤ x
a. What is the pmf of X?b. Using just the cdf, compute P(3≤ X ≤6) and P(4≤ X).
59. At a certain gas station, 40% of the customers use regular gas (A1), 35% use plus gas (A2), and 25% use premium (A3). Of those customers using regular gas, only 30% fill their tanks (event B). Of those customers using plus, 60% fill their tanks, whereas of those using premium, 50% fill their tanks.a. What is the probability that the next customer will request plus gas and fill the tank (A2 B)?b. What is the probability that the next customer fills the tank?c. If the next customer fills the tank, what is the probability that regular gas is requested? Plus? Premium?
Chapter 4 Solutions
Fundamentals of Statistics Plus MyLab Statistics with Pearson eText - Title-Specific Access Card Package (5th Edition)
Ch. 4.1 - What is the difference between univariate data and...Ch. 4.1 - The _____ variable is the variable whose value can...Ch. 4.1 - A _____ _____ is a graph that shows the relation...Ch. 4.1 - What does it mean to say two variables are...Ch. 4.1 - If r = _____, then a perfect negative linear...Ch. 4.1 - True or False: If the linear correlation...Ch. 4.1 - A _____ variable is a variable that is related to...Ch. 4.1 - True or False: Correlation implies causation.Ch. 4.1 - In Problems 912, determine whether the scatter...Ch. 4.1 - In Problems 912, determine whether the scatter...
Ch. 4.1 - In Problems 912, determine whether the scatter...Ch. 4.1 - In Problems 912, determine whether the scatter...Ch. 4.1 - NW Match the linear correlation coefficient to the...Ch. 4.1 - Match the linear correlation coefficient to the...Ch. 4.1 - Prob. 15AYUCh. 4.1 - Relation between Education and Birthrate? The...Ch. 4.1 - In Problems 1720, (a) draw a scatter diagram of...Ch. 4.1 - In Problems 1720, (a) draw a scatter diagram of...Ch. 4.1 - In Problems 1720, (a) draw a scatter diagram of...Ch. 4.1 - In Problems 1720, (a) draw a scatter diagram of...Ch. 4.1 - Name the Relation, Part I For each of the...Ch. 4.1 - Prob. 22AYUCh. 4.1 - The TIMMS Exam The Trends in International...Ch. 4.1 - Prob. 24AYUCh. 4.1 - NW An Unhealthy Commute The Gallup Organization...Ch. 4.1 - Credit Scores Your Fair Isaacs Corporation (FICO)...Ch. 4.1 - Height versus Head Circumference A pediatrician...Ch. 4.1 - American Black Bears The American black bear...Ch. 4.1 - Weight of a Car versus Miles per Gallon An...Ch. 4.1 - Hurricanes The data in the next column represent...Ch. 4.1 - CEO Performance The following data represent the...Ch. 4.1 - Bear Markets A bear market in the stock market is...Ch. 4.1 - Does Size Matter? Researchers wondered whether the...Ch. 4.1 - Prob. 34AYUCh. 4.1 - Weight of a Car versus Miles per Gallon Suppose...Ch. 4.1 - American Black Bears The website that contained...Ch. 4.1 - Draw Your Data! Consider the four data sets shown...Ch. 4.1 - Predicting Winning Percentage The ultimate goal in...Ch. 4.1 - Prob. 39AYUCh. 4.1 - Lyme Disease versus Drownings Lyme disease is an...Ch. 4.1 - Prob. 41AYUCh. 4.1 - Prob. 42AYUCh. 4.1 - Crime Rate and Cell Phones The linear correlation...Ch. 4.1 - Prob. 44AYUCh. 4.1 - Influential Consider the following set of data: a....Ch. 4.1 - Prob. 46AYUCh. 4.1 - Prob. 47AYUCh. 4.1 - Prob. 48AYUCh. 4.1 - What does it mean to say that the linear...Ch. 4.1 - What does it mean if r = 0?Ch. 4.1 - Prob. 51AYUCh. 4.1 - Prob. 52AYUCh. 4.1 - Explain the difference between correlation and...Ch. 4.1 - Suppose that two variables, x and y, are...Ch. 4.2 - The difference between the observed and predicted...Ch. 4.2 - If the linear correlation between two variables is...Ch. 4.2 - Prob. 3AYUCh. 4.2 - Prob. 4AYUCh. 4.2 - For the data set a. Draw a scatter diagram....Ch. 4.2 - For the data set a. Draw a scatter diagram....Ch. 4.2 - In Problems 712: a. By hand, draw a scatter...Ch. 4.2 - In Problems 712: a. By hand, draw a scatter...Ch. 4.2 - Prob. 9AYUCh. 4.2 - In Problems 712: a. By hand, draw a scatter...Ch. 4.2 - In Problems 712: a. By hand, draw a scatter...Ch. 4.2 - In Problems 712: a. By hand, draw a scatter...Ch. 4.2 - NW Income and Education In Problem 15 from Section...Ch. 4.2 - You Explain It! Study Time and Exam Scores After...Ch. 4.2 - Age Gap at Marriage Is there a relation between...Ch. 4.2 - You Explain It! CO2 and Energy Production The...Ch. 4.2 - NW An Unhealthy Commute (Refer to Problem 25,...Ch. 4.2 - Credit Scores (Refer to Problem 26, Section 4.1.)...Ch. 4.2 - Height versus Head Circumference (Refer to Problem...Ch. 4.2 - Prob. 20AYUCh. 4.2 - Weight of a Car versus Miles per Gallon (Refer to...Ch. 4.2 - Hurricanes (Refer to Problem 30, Section 4.1) The...Ch. 4.2 - Cola Consumption vs. Bone Density Example 5 in...Ch. 4.2 - Attending Class The following data represent the...Ch. 4.2 - CEO Performance (Refer to Problem 31 in Section...Ch. 4.2 - Bear Markets (Refer to Problem 32, Section 4.1) A...Ch. 4.2 - Male vs. Female Drivers (Refer to Problem 34,...Ch. 4.2 - Graduation Rates Go to...Ch. 4.2 - Putting It Together: Housing Prices One of the...Ch. 4.2 - Putting It Together: Smoking and Birth Weight It...Ch. 4.2 - What is a residual? What does it mean when a...Ch. 4.2 - Explain the phrase outside the scope of the model....Ch. 4.2 - Explain what each point on the least-squares...Ch. 4.3 - The _____ _____ _____, R2, measures the proportion...Ch. 4.3 - Total deviation = _____ deviation + _____...Ch. 4.3 - Match each coefficient of determination to a...Ch. 4.3 - NW The Other Old Faithful Perhaps you are familiar...Ch. 4.3 - Concrete As concrete cures, it gains strength. The...Ch. 4.3 - Prob. 7AYUCh. 4.3 - Problems 712 use the results from Problems 2530 in...Ch. 4.3 - Prob. 9AYUCh. 4.3 - Problems 712 use the results from Problems 2530 in...Ch. 4.3 - Problems 712 use the results from Problems 2530 in...Ch. 4.3 - Prob. 12AYUCh. 4.3 - Weight of a Car versus Miles per Gallon Suppose...Ch. 4.3 - American Black Bears Suppose that we find a bear...Ch. 4.3 - Putting It Together: Exam Scores The data below...Ch. 4.3 - Sullivan Survey II Go to...Ch. 4.4 - What is meant by a marginal distribution? What is...Ch. 4.4 - Refer to Table 8. Is constructing a conditional...Ch. 4.4 - Prob. 3AYUCh. 4.4 - Explain the idea behind Simpsons Paradox.Ch. 4.4 - In Problems 5 and 6, a. Construct a frequency...Ch. 4.4 - In Problems 5 and 6, a. Construct a frequency...Ch. 4.4 - Made in America In a recent Harris Poll, a random...Ch. 4.4 - Desirability Traits In a recent Harris Poll, a...Ch. 4.4 - NW Party Affiliation Is there an association...Ch. 4.4 - Prob. 10AYUCh. 4.4 - Health and Happiness The General Social Survey...Ch. 4.4 - Happy in Your Marriage? The General Social Survey...Ch. 4.4 - Prob. 13AYUCh. 4.4 - Treating Kidney Stones Researchers conducted a...Ch. 4.4 - Sullivan Survey II Go to...Ch. 4 - Basketball Spreads In sports betting, Las Vegas...Ch. 4 - Fat and Calories in Cheeseburgers A nutritionist...Ch. 4 - Prob. 3RECh. 4 - Prob. 4RECh. 4 - Prob. 5RECh. 4 - a. Draw a scatter diagram treating x as the...Ch. 4 - Use the results from Problems 2 and 4 to compute...Ch. 4 - Prob. 8RECh. 4 - Prob. 9RECh. 4 - New versus Used Car Satisfaction Are you more...Ch. 4 - Unemployment Rates Recessions are an economic...Ch. 4 - Prob. 12RECh. 4 - Prob. 13RECh. 4 - Prob. 1CTCh. 4 - Use the data from Problem 1. a. Find the...Ch. 4 - Use the results from Problems 1 and 2 to compute...Ch. 4 - The following data represent the speed of a car...Ch. 4 - Prob. 5CTCh. 4 - Prob. 6CTCh. 4 - Consider the following contingency table, which...Ch. 4 - What would you say about a set of quantitative...Ch. 4 - If the slope of a least-squares regression line is...Ch. 4 - What does it mean if a linear correlation...
Knowledge Booster


Learn more about
Need a deep-dive on the concept behind this application? Look no further. Learn more about this topic, statistics and related others by exploring similar questions and additional content below.Similar questions
- 38. Possible values of X, the number of components in a system submitted for repair that must be replaced, are 1, 2, 3, and 4 with corresponding probabilities .15, .35, .35, and .15, respectively. a. Calculate E(X) and then E(5 - X).b. Would the repair facility be better off charging a flat fee of $75 or else the amount $[150/(5 - X)]? [Note: It is not generally true that E(c/Y) = c/E(Y).]arrow_forward74. The proportions of blood phenotypes in the U.S. popula- tion are as follows:A B AB O .40 .11 .04 .45 Assuming that the phenotypes of two randomly selected individuals are independent of one another, what is the probability that both phenotypes are O? What is the probability that the phenotypes of two randomly selected individuals match?arrow_forward53. A certain shop repairs both audio and video compo- nents. Let A denote the event that the next component brought in for repair is an audio component, and let B be the event that the next component is a compact disc player (so the event B is contained in A). Suppose that P(A) = .6 and P(B) = .05. What is P(BA)?arrow_forward
- 26. A certain system can experience three different types of defects. Let A;(i = 1,2,3) denote the event that the sys- tem has a defect of type i. Suppose thatP(A1) = .12 P(A) = .07 P(A) = .05P(A, U A2) = .13P(A, U A3) = .14P(A2 U A3) = .10P(A, A2 A3) = .011Rshelfa. What is the probability that the system does not havea type 1 defect?b. What is the probability that the system has both type 1 and type 2 defects?c. What is the probability that the system has both type 1 and type 2 defects but not a type 3 defect? d. What is the probability that the system has at most two of these defects?arrow_forwardThe following are suggested designs for group sequential studies. Using PROCSEQDESIGN, provide the following for the design O’Brien Fleming and Pocock.• The critical boundary values for each analysis of the data• The expected sample sizes at each interim analysisAssume the standardized Z score method for calculating boundaries.Investigators are evaluating the success rate of a novel drug for treating a certain type ofbacterial wound infection. Since no existing treatment exists, they have planned a one-armstudy. They wish to test whether the success rate of the drug is better than 50%, whichthey have defined as the null success rate. Preliminary testing has estimated the successrate of the drug at 55%. The investigators are eager to get the drug into production andwould like to plan for 9 interim analyses (10 analyzes in total) of the data. Assume thesignificance level is 5% and power is 90%.Besides, draw a combined boundary plot (OBF, POC, and HP)arrow_forwardPlease provide the solution for the attached image in detailed.arrow_forward
- 20 km, because GISS Worksheet 10 Jesse runs a small business selling and delivering mealie meal to the spaza shops. He charges a fixed rate of R80, 00 for delivery and then R15, 50 for each packet of mealle meal he delivers. The table below helps him to calculate what to charge his customers. 10 20 30 40 50 Packets of mealie meal (m) Total costs in Rands 80 235 390 545 700 855 (c) 10.1. Define the following terms: 10.1.1. Independent Variables 10.1.2. Dependent Variables 10.2. 10.3. 10.4. 10.5. Determine the independent and dependent variables. Are the variables in this scenario discrete or continuous values? Explain What shape do you expect the graph to be? Why? Draw a graph on the graph provided to represent the information in the table above. TOTAL COST OF PACKETS OF MEALIE MEAL 900 800 700 600 COST (R) 500 400 300 200 100 0 10 20 30 40 60 NUMBER OF PACKETS OF MEALIE MEALarrow_forwardLet X be a random variable with support SX = {−3, 0.5, 3, −2.5, 3.5}. Part ofits probability mass function (PMF) is given bypX(−3) = 0.15, pX(−2.5) = 0.3, pX(3) = 0.2, pX(3.5) = 0.15.(a) Find pX(0.5).(b) Find the cumulative distribution function (CDF), FX(x), of X.1(c) Sketch the graph of FX(x).arrow_forwardA well-known company predominantly makes flat pack furniture for students. Variability with the automated machinery means the wood components are cut with a standard deviation in length of 0.45 mm. After they are cut the components are measured. If their length is more than 1.2 mm from the required length, the components are rejected. a) Calculate the percentage of components that get rejected. b) In a manufacturing run of 1000 units, how many are expected to be rejected? c) The company wishes to install more accurate equipment in order to reduce the rejection rate by one-half, using the same ±1.2mm rejection criterion. Calculate the maximum acceptable standard deviation of the new process.arrow_forward
- 5. Let X and Y be independent random variables and let the superscripts denote symmetrization (recall Sect. 3.6). Show that (X + Y) X+ys.arrow_forward8. Suppose that the moments of the random variable X are constant, that is, suppose that EX" =c for all n ≥ 1, for some constant c. Find the distribution of X.arrow_forward9. The concentration function of a random variable X is defined as Qx(h) = sup P(x ≤ X ≤x+h), h>0. Show that, if X and Y are independent random variables, then Qx+y (h) min{Qx(h). Qr (h)).arrow_forward
arrow_back_ios
SEE MORE QUESTIONS
arrow_forward_ios
Recommended textbooks for you
 Functions and Change: A Modeling Approach to Coll...AlgebraISBN:9781337111348Author:Bruce Crauder, Benny Evans, Alan NoellPublisher:Cengage Learning
 Big Ideas Math A Bridge To Success Algebra 1: Stu...AlgebraISBN:9781680331141Author:HOUGHTON MIFFLIN HARCOURTPublisher:Houghton Mifflin Harcourt
 Linear Algebra: A Modern IntroductionAlgebraISBN:9781285463247Author:David PoolePublisher:Cengage Learning
 Glencoe Algebra 1, Student Edition, 9780079039897...AlgebraISBN:9780079039897Author:CarterPublisher:McGraw Hill
 Holt Mcdougal Larson Pre-algebra: Student Edition...AlgebraISBN:9780547587776Author:HOLT MCDOUGALPublisher:HOLT MCDOUGAL
 College AlgebraAlgebraISBN:9781305115545Author:James Stewart, Lothar Redlin, Saleem WatsonPublisher:Cengage Learning
Functions and Change: A Modeling Approach to Coll...
Algebra
ISBN:9781337111348
Author:Bruce Crauder, Benny Evans, Alan Noell
Publisher:Cengage Learning
Big Ideas Math A Bridge To Success Algebra 1: Stu...
Algebra
ISBN:9781680331141
Author:HOUGHTON MIFFLIN HARCOURT
Publisher:Houghton Mifflin Harcourt
Linear Algebra: A Modern Introduction
Algebra
ISBN:9781285463247
Author:David Poole
Publisher:Cengage Learning
Glencoe Algebra 1, Student Edition, 9780079039897...
Algebra
ISBN:9780079039897
Author:Carter
Publisher:McGraw Hill
Holt Mcdougal Larson Pre-algebra: Student Edition...
Algebra
ISBN:9780547587776
Author:HOLT MCDOUGAL
Publisher:HOLT MCDOUGAL
College Algebra
Algebra
ISBN:9781305115545
Author:James Stewart, Lothar Redlin, Saleem Watson
Publisher:Cengage Learning
Time Series Analysis Theory & Uni-variate Forecasting Techniques; Author: Analytics University;https://www.youtube.com/watch?v=_X5q9FYLGxM;License: Standard YouTube License, CC-BY
Operations management 101: Time-series, forecasting introduction; Author: Brandoz Foltz;https://www.youtube.com/watch?v=EaqZP36ool8;License: Standard YouTube License, CC-BY