
Fundamentals of Statistics Plus MyLab Statistics with Pearson eText - Title-Specific Access Card Package (5th Edition)
5th Edition
ISBN: 9780134763729
Author: Michael Sullivan III
Publisher: PEARSON
expand_more
expand_more
format_list_bulleted
Concept explainers
Videos
Textbook Question
Chapter 4.1, Problem 33AYU
Does Size Matter? Researchers wondered whether the size of a person’s brain was related to the individual’s mental capacity. They selected a sample of right-handed introductory psychology students who had SAT scores higher than 1350. The subjects took the Wechsler Adult Intelligence Scale-Revised to obtain their IQ scores. MRI scans were performed at the same facility for the subjects. The scans consisted of 18 horizontal MR images. The computer counted all pixels with a nonzero gray scale in each of the 18 images, and the total count served as an index for brain size.
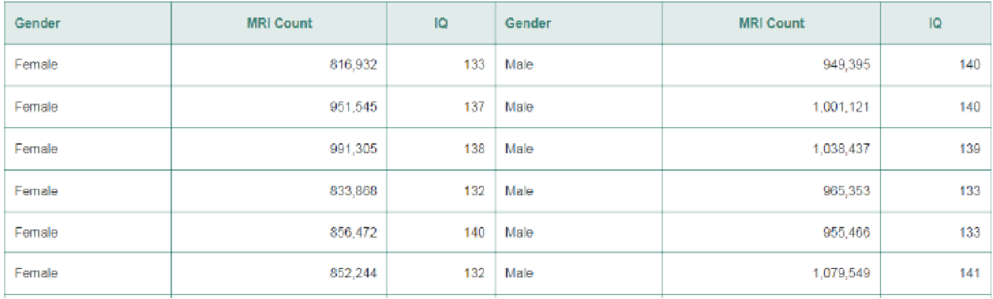
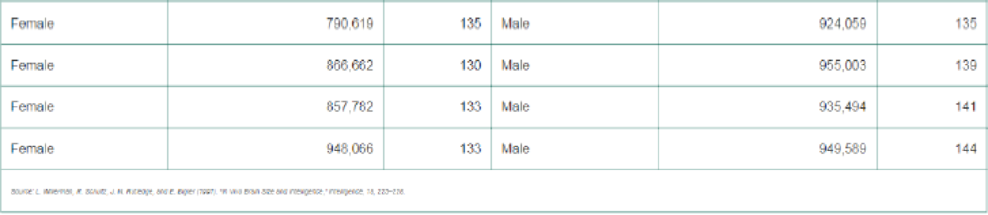
- a. Draw a
scatter diagram treating MRI count as the explanatory variable and IQ as the response variable. Comment on what you see. - b. Compute the linear
correlation coefficient between MRI count and IQ. Are MRI count and IQ linearly related? - c. A lurking variable in the analysis is gender. Draw a scatter diagram treating MRI count as the explanatory variable and IQ as the response variable, but use a different plotting symbol for each gender. For example, use a circle for males and a triangle for females. What do you notice?
- d. Compute the linear correlation coefficient between MRI count and IQ for females. Compute the linear correlation coefficient between MRI count and IQ for males. Are MRI count and IQ linearly related? What is the moral?
Expert Solution & Answer
Want to see the full answer?
Check out a sample textbook solution
Students have asked these similar questions
A well-known company predominantly makes flat pack furniture for students. Variability with the automated machinery means the wood components are cut with a standard deviation in length of 0.45 mm. After they are cut the components are measured. If their length is more than 1.2 mm from the required length, the components are rejected.
a) Calculate the percentage of components that get rejected.
b) In a manufacturing run of 1000 units, how many are expected to be rejected?
c) The company wishes to install more accurate equipment in order to reduce the rejection rate by one-half, using the same ±1.2mm rejection criterion. Calculate the maximum acceptable standard deviation of the new process.
5. Let X and Y be independent random variables and let the superscripts denote
symmetrization (recall Sect. 3.6). Show that
(X + Y) X+ys.
8. Suppose that the moments of the random variable X are constant, that is, suppose
that EX" =c for all n ≥ 1, for some constant c. Find the distribution of X.
Chapter 4 Solutions
Fundamentals of Statistics Plus MyLab Statistics with Pearson eText - Title-Specific Access Card Package (5th Edition)
Ch. 4.1 - What is the difference between univariate data and...Ch. 4.1 - The _____ variable is the variable whose value can...Ch. 4.1 - A _____ _____ is a graph that shows the relation...Ch. 4.1 - What does it mean to say two variables are...Ch. 4.1 - If r = _____, then a perfect negative linear...Ch. 4.1 - True or False: If the linear correlation...Ch. 4.1 - A _____ variable is a variable that is related to...Ch. 4.1 - True or False: Correlation implies causation.Ch. 4.1 - In Problems 912, determine whether the scatter...Ch. 4.1 - In Problems 912, determine whether the scatter...
Ch. 4.1 - In Problems 912, determine whether the scatter...Ch. 4.1 - In Problems 912, determine whether the scatter...Ch. 4.1 - NW Match the linear correlation coefficient to the...Ch. 4.1 - Match the linear correlation coefficient to the...Ch. 4.1 - Prob. 15AYUCh. 4.1 - Relation between Education and Birthrate? The...Ch. 4.1 - In Problems 1720, (a) draw a scatter diagram of...Ch. 4.1 - In Problems 1720, (a) draw a scatter diagram of...Ch. 4.1 - In Problems 1720, (a) draw a scatter diagram of...Ch. 4.1 - In Problems 1720, (a) draw a scatter diagram of...Ch. 4.1 - Name the Relation, Part I For each of the...Ch. 4.1 - Prob. 22AYUCh. 4.1 - The TIMMS Exam The Trends in International...Ch. 4.1 - Prob. 24AYUCh. 4.1 - NW An Unhealthy Commute The Gallup Organization...Ch. 4.1 - Credit Scores Your Fair Isaacs Corporation (FICO)...Ch. 4.1 - Height versus Head Circumference A pediatrician...Ch. 4.1 - American Black Bears The American black bear...Ch. 4.1 - Weight of a Car versus Miles per Gallon An...Ch. 4.1 - Hurricanes The data in the next column represent...Ch. 4.1 - CEO Performance The following data represent the...Ch. 4.1 - Bear Markets A bear market in the stock market is...Ch. 4.1 - Does Size Matter? Researchers wondered whether the...Ch. 4.1 - Prob. 34AYUCh. 4.1 - Weight of a Car versus Miles per Gallon Suppose...Ch. 4.1 - American Black Bears The website that contained...Ch. 4.1 - Draw Your Data! Consider the four data sets shown...Ch. 4.1 - Predicting Winning Percentage The ultimate goal in...Ch. 4.1 - Prob. 39AYUCh. 4.1 - Lyme Disease versus Drownings Lyme disease is an...Ch. 4.1 - Prob. 41AYUCh. 4.1 - Prob. 42AYUCh. 4.1 - Crime Rate and Cell Phones The linear correlation...Ch. 4.1 - Prob. 44AYUCh. 4.1 - Influential Consider the following set of data: a....Ch. 4.1 - Prob. 46AYUCh. 4.1 - Prob. 47AYUCh. 4.1 - Prob. 48AYUCh. 4.1 - What does it mean to say that the linear...Ch. 4.1 - What does it mean if r = 0?Ch. 4.1 - Prob. 51AYUCh. 4.1 - Prob. 52AYUCh. 4.1 - Explain the difference between correlation and...Ch. 4.1 - Suppose that two variables, x and y, are...Ch. 4.2 - The difference between the observed and predicted...Ch. 4.2 - If the linear correlation between two variables is...Ch. 4.2 - Prob. 3AYUCh. 4.2 - Prob. 4AYUCh. 4.2 - For the data set a. Draw a scatter diagram....Ch. 4.2 - For the data set a. Draw a scatter diagram....Ch. 4.2 - In Problems 712: a. By hand, draw a scatter...Ch. 4.2 - In Problems 712: a. By hand, draw a scatter...Ch. 4.2 - Prob. 9AYUCh. 4.2 - In Problems 712: a. By hand, draw a scatter...Ch. 4.2 - In Problems 712: a. By hand, draw a scatter...Ch. 4.2 - In Problems 712: a. By hand, draw a scatter...Ch. 4.2 - NW Income and Education In Problem 15 from Section...Ch. 4.2 - You Explain It! Study Time and Exam Scores After...Ch. 4.2 - Age Gap at Marriage Is there a relation between...Ch. 4.2 - You Explain It! CO2 and Energy Production The...Ch. 4.2 - NW An Unhealthy Commute (Refer to Problem 25,...Ch. 4.2 - Credit Scores (Refer to Problem 26, Section 4.1.)...Ch. 4.2 - Height versus Head Circumference (Refer to Problem...Ch. 4.2 - Prob. 20AYUCh. 4.2 - Weight of a Car versus Miles per Gallon (Refer to...Ch. 4.2 - Hurricanes (Refer to Problem 30, Section 4.1) The...Ch. 4.2 - Cola Consumption vs. Bone Density Example 5 in...Ch. 4.2 - Attending Class The following data represent the...Ch. 4.2 - CEO Performance (Refer to Problem 31 in Section...Ch. 4.2 - Bear Markets (Refer to Problem 32, Section 4.1) A...Ch. 4.2 - Male vs. Female Drivers (Refer to Problem 34,...Ch. 4.2 - Graduation Rates Go to...Ch. 4.2 - Putting It Together: Housing Prices One of the...Ch. 4.2 - Putting It Together: Smoking and Birth Weight It...Ch. 4.2 - What is a residual? What does it mean when a...Ch. 4.2 - Explain the phrase outside the scope of the model....Ch. 4.2 - Explain what each point on the least-squares...Ch. 4.3 - The _____ _____ _____, R2, measures the proportion...Ch. 4.3 - Total deviation = _____ deviation + _____...Ch. 4.3 - Match each coefficient of determination to a...Ch. 4.3 - NW The Other Old Faithful Perhaps you are familiar...Ch. 4.3 - Concrete As concrete cures, it gains strength. The...Ch. 4.3 - Prob. 7AYUCh. 4.3 - Problems 712 use the results from Problems 2530 in...Ch. 4.3 - Prob. 9AYUCh. 4.3 - Problems 712 use the results from Problems 2530 in...Ch. 4.3 - Problems 712 use the results from Problems 2530 in...Ch. 4.3 - Prob. 12AYUCh. 4.3 - Weight of a Car versus Miles per Gallon Suppose...Ch. 4.3 - American Black Bears Suppose that we find a bear...Ch. 4.3 - Putting It Together: Exam Scores The data below...Ch. 4.3 - Sullivan Survey II Go to...Ch. 4.4 - What is meant by a marginal distribution? What is...Ch. 4.4 - Refer to Table 8. Is constructing a conditional...Ch. 4.4 - Prob. 3AYUCh. 4.4 - Explain the idea behind Simpsons Paradox.Ch. 4.4 - In Problems 5 and 6, a. Construct a frequency...Ch. 4.4 - In Problems 5 and 6, a. Construct a frequency...Ch. 4.4 - Made in America In a recent Harris Poll, a random...Ch. 4.4 - Desirability Traits In a recent Harris Poll, a...Ch. 4.4 - NW Party Affiliation Is there an association...Ch. 4.4 - Prob. 10AYUCh. 4.4 - Health and Happiness The General Social Survey...Ch. 4.4 - Happy in Your Marriage? The General Social Survey...Ch. 4.4 - Prob. 13AYUCh. 4.4 - Treating Kidney Stones Researchers conducted a...Ch. 4.4 - Sullivan Survey II Go to...Ch. 4 - Basketball Spreads In sports betting, Las Vegas...Ch. 4 - Fat and Calories in Cheeseburgers A nutritionist...Ch. 4 - Prob. 3RECh. 4 - Prob. 4RECh. 4 - Prob. 5RECh. 4 - a. Draw a scatter diagram treating x as the...Ch. 4 - Use the results from Problems 2 and 4 to compute...Ch. 4 - Prob. 8RECh. 4 - Prob. 9RECh. 4 - New versus Used Car Satisfaction Are you more...Ch. 4 - Unemployment Rates Recessions are an economic...Ch. 4 - Prob. 12RECh. 4 - Prob. 13RECh. 4 - Prob. 1CTCh. 4 - Use the data from Problem 1. a. Find the...Ch. 4 - Use the results from Problems 1 and 2 to compute...Ch. 4 - The following data represent the speed of a car...Ch. 4 - Prob. 5CTCh. 4 - Prob. 6CTCh. 4 - Consider the following contingency table, which...Ch. 4 - What would you say about a set of quantitative...Ch. 4 - If the slope of a least-squares regression line is...Ch. 4 - What does it mean if a linear correlation...
Knowledge Booster


Learn more about
Need a deep-dive on the concept behind this application? Look no further. Learn more about this topic, statistics and related others by exploring similar questions and additional content below.Similar questions
- 9. The concentration function of a random variable X is defined as Qx(h) = sup P(x ≤ X ≤x+h), h>0. Show that, if X and Y are independent random variables, then Qx+y (h) min{Qx(h). Qr (h)).arrow_forward10. Prove that, if (t)=1+0(12) as asf->> O is a characteristic function, then p = 1.arrow_forward9. The concentration function of a random variable X is defined as Qx(h) sup P(x ≤x≤x+h), h>0. (b) Is it true that Qx(ah) =aQx (h)?arrow_forward
- 3. Let X1, X2,..., X, be independent, Exp(1)-distributed random variables, and set V₁₁ = max Xk and W₁ = X₁+x+x+ Isk≤narrow_forward7. Consider the function (t)=(1+|t|)e, ER. (a) Prove that is a characteristic function. (b) Prove that the corresponding distribution is absolutely continuous. (c) Prove, departing from itself, that the distribution has finite mean and variance. (d) Prove, without computation, that the mean equals 0. (e) Compute the density.arrow_forward1. Show, by using characteristic, or moment generating functions, that if fx(x) = ½ex, -∞0 < x < ∞, then XY₁ - Y2, where Y₁ and Y2 are independent, exponentially distributed random variables.arrow_forward
- 1. Show, by using characteristic, or moment generating functions, that if 1 fx(x): x) = ½exarrow_forward1990) 02-02 50% mesob berceus +7 What's the probability of getting more than 1 head on 10 flips of a fair coin?arrow_forward9. The concentration function of a random variable X is defined as Qx(h) sup P(x≤x≤x+h), h>0. = x (a) Show that Qx+b(h) = Qx(h).arrow_forward
- Suppose that you buy a lottery ticket, and you have to pick six numbers from 1 through 50 (repetitions allowed). Which combination is more likely to win: 13, 48, 17, 22, 6, 39 or 1, 2, 3, 4, 5, 6? barrow_forward2 Make a histogram from this data set of test scores: 72, 79, 81, 80, 63, 62, 89, 99, 50, 78, 87, 97, 55, 69, 97, 87, 88, 99, 76, 78, 65, 77, 88, 90, and 81. Would a pie chart be appropriate for this data? ganizing Quantitative Data: Charts and Graphs 45arrow_forward10 Meteorologists use computer models to predict when and where a hurricane will hit shore. Suppose they predict that hurricane Stat has a 20 percent chance of hitting the East Coast. a. On what info are the meteorologists basing this prediction? b. Why is this prediction harder to make than your chance of getting a head on your next coin toss? U anoiaarrow_forward
arrow_back_ios
SEE MORE QUESTIONS
arrow_forward_ios
Recommended textbooks for you
 Big Ideas Math A Bridge To Success Algebra 1: Stu...AlgebraISBN:9781680331141Author:HOUGHTON MIFFLIN HARCOURTPublisher:Houghton Mifflin Harcourt
 Glencoe Algebra 1, Student Edition, 9780079039897...AlgebraISBN:9780079039897Author:CarterPublisher:McGraw Hill
 Holt Mcdougal Larson Pre-algebra: Student Edition...AlgebraISBN:9780547587776Author:HOLT MCDOUGALPublisher:HOLT MCDOUGAL
 Functions and Change: A Modeling Approach to Coll...AlgebraISBN:9781337111348Author:Bruce Crauder, Benny Evans, Alan NoellPublisher:Cengage Learning
Big Ideas Math A Bridge To Success Algebra 1: Stu...
Algebra
ISBN:9781680331141
Author:HOUGHTON MIFFLIN HARCOURT
Publisher:Houghton Mifflin Harcourt
Glencoe Algebra 1, Student Edition, 9780079039897...
Algebra
ISBN:9780079039897
Author:Carter
Publisher:McGraw Hill
Holt Mcdougal Larson Pre-algebra: Student Edition...
Algebra
ISBN:9780547587776
Author:HOLT MCDOUGAL
Publisher:HOLT MCDOUGAL
Functions and Change: A Modeling Approach to Coll...
Algebra
ISBN:9781337111348
Author:Bruce Crauder, Benny Evans, Alan Noell
Publisher:Cengage Learning
Statistics 4.1 Point Estimators; Author: Dr. Jack L. Jackson II;https://www.youtube.com/watch?v=2MrI0J8XCEE;License: Standard YouTube License, CC-BY
Statistics 101: Point Estimators; Author: Brandon Foltz;https://www.youtube.com/watch?v=4v41z3HwLaM;License: Standard YouTube License, CC-BY
Central limit theorem; Author: 365 Data Science;https://www.youtube.com/watch?v=b5xQmk9veZ4;License: Standard YouTube License, CC-BY
Point Estimate Definition & Example; Author: Prof. Essa;https://www.youtube.com/watch?v=OTVwtvQmSn0;License: Standard Youtube License
Point Estimation; Author: Vamsidhar Ambatipudi;https://www.youtube.com/watch?v=flqhlM2bZWc;License: Standard Youtube License