Student Solutions Manual for Brase/Brase's Understanding Basic Statistics, 7th
7th Edition
ISBN: 9781305258792
Author: BRASE, Charles Henry
Publisher: Cengage Learning
bartleby

Concept explainers

bartleby

Videos

Textbook Question
Book Icon
Chapter 4.2, Problem 19P

Expand Your Knowledge: Residual Plot The least-squares line usually does not go through all the sample data points (x, y). In fact, for a specified x value from a data pair (x, y), there is usually a difference between the predicted value and the y value paired with x. This difference is called the residual.

The residual is the difference between the y value in a specified data pair (x, y) and the value y ^ = a + b x predicted by the least-squares line for the same x.

y y ^ is the residual.

One way to assess how well a least-squares line serves as a model for the data is a residual plot. To make a residual plot, we pull the x values in order on the horizontal axis and plot the corresponding residuals y y ^ in the vertical direction. Because the mean of the residuals is always zero for a least-squares model, we place a horizontal line at zero. The accompanying figure shows a residual plot for the data of Guided Exercise 4, in which the relationship between the number of ads run per week and the number of cars sold that week was explored. To make the residual plot, first compute all the residuals. Remember that x and y are the given data values and that y ^ is computed from the least-squares line y ^ 6.56 + 1.01 x .

Residual
X y y ^ y y ^
6 15 12.6 2.4
20 31 26.8 4.2
0 10 6.6 3.4
14 16 20.7 -4.7
25 28 31.8 -3.8
Residual
X y y ^ y y ^
16 20 22.7 -2.7
28 40 34.8 5.2
18 25 24.7 0.3
10 12 16.7 -4.7
8 15 14.6 0.4

Chapter 4.2, Problem 19P, Expand Your Knowledge: Residual Plot The least-squares line usually does not go through all the

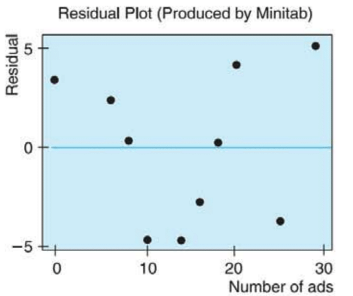
If the least-squares line provides a reasonable model for the data, the pattern of points in the plot will seem random and unstructured about the horizontal line at 0. Is this the case for the residual plot?

If a point on the residual plot seems far outside the pattern of other points, it might reflect an unusual data point (x. y), called an outlier. Such points may have quite an influence on the least-squares model. Do there appear to be any outliers in the data for the residual plot?

Blurred answer
Students have asked these similar questions
The following are suggested designs for group sequential studies. Using PROCSEQDESIGN, provide the following for the design O’Brien Fleming and Pocock.• The critical boundary values for each analysis of the data• The expected sample sizes at each interim analysisAssume the standardized Z score method for calculating boundaries.Investigators are evaluating the success rate of a novel drug for treating a certain type ofbacterial wound infection. Since no existing treatment exists, they have planned a one-armstudy. They wish to test whether the success rate of the drug is better than 50%, whichthey have defined as the null success rate. Preliminary testing has estimated the successrate of the drug at 55%. The investigators are eager to get the drug into production andwould like to plan for 9 interim analyses (10 analyzes in total) of the data. Assume thesignificance level is 5% and power is 90%.Besides, draw a combined boundary plot (OBF, POC, and HP)
Please provide the solution for the attached image in detailed.
20 km, because GISS Worksheet 10 Jesse runs a small business selling and delivering mealie meal to the spaza shops. He charges a fixed rate of R80, 00 for delivery and then R15, 50 for each packet of mealle meal he delivers. The table below helps him to calculate what to charge his customers. 10 20 30 40 50 Packets of mealie meal (m) Total costs in Rands 80 235 390 545 700 855 (c) 10.1. Define the following terms: 10.1.1. Independent Variables 10.1.2. Dependent Variables 10.2. 10.3. 10.4. 10.5. Determine the independent and dependent variables. Are the variables in this scenario discrete or continuous values? Explain What shape do you expect the graph to be? Why? Draw a graph on the graph provided to represent the information in the table above. TOTAL COST OF PACKETS OF MEALIE MEAL 900 800 700 600 COST (R) 500 400 300 200 100 0 10 20 30 40 60 NUMBER OF PACKETS OF MEALIE MEAL

Chapter 4 Solutions

Student Solutions Manual for Brase/Brase's Understanding Basic Statistics, 7th

Ch. 4.1 - Interpretation Trevor conducted a study and found...Ch. 4.1 - Interpretation Do people who spend more time on...Ch. 4.1 - Veterinary Science: Shetland Ponies How much...Ch. 4.1 - Health Insurance:Administrative Cost The following...Ch. 4.1 - Meteorology: Cyclones Can a low barometer reading...Ch. 4.1 - Geology: Earthquakes Is the magnitude of an...Ch. 4.1 - Baseball: Batting Averages and Home Runs In...Ch. 4.1 - University Crime: FBI Report Do larger...Ch. 4.1 - Prob. 19PCh. 4.1 - Prob. 20PCh. 4.1 - Expand Your Knowledge: Using a Table to Test The...Ch. 4.1 - Expand Your Knowledge: Sample Size and...Ch. 4.1 - Prob. 23PCh. 4.2 - Statistical Literacy In the least-squares line...Ch. 4.2 - Statistical Literacy In the least squares line...Ch. 4.2 - Critical Thinking When we use a least-squares line...Ch. 4.2 - Critical Thinking If two variables have a negative...Ch. 4.2 - Critical Thinking: Interpreting Computer Printouts...Ch. 4.2 - Critical Thinking: Interpreting Computer Printouts...Ch. 4.2 - Economics: Entry-Level Jobs An economist is...Ch. 4.2 - Ranching: Cattle You are the foreman of the Bar-S...Ch. 4.2 - Weight of Car: Miles per Gallon Do heavier cars...Ch. 4.2 - Basketball: Fouls Data for this problem are based...Ch. 4.2 - Auto Accidents: Age Data for this problem are...Ch. 4.2 - Auto Accidents: Age Let x be the age of a licensed...Ch. 4.2 - Incoine: Medicai Care Let x be per capita income...Ch. 4.2 - Violent Crimes: Prisons Does prison really deter...Ch. 4.2 - Education: Violent Crime The following data are...Ch. 4.2 - Research: Patents The following data are based on...Ch. 4.2 - Archaeology: Artifacts Data for this problem are...Ch. 4.2 - Cricket Chirps: Temperature Anyone who has been...Ch. 4.2 - Expand Your Knowledge: Residual Plot The...Ch. 4.2 - Residual Plot: Miles per Gallon Consider the data...Ch. 4.2 - Expand Your knowledge: Logarithmic...Ch. 4.2 - Expand Your Knowledge: Logarithmic...Ch. 4.2 - Prob. 24PCh. 4.2 - Expand Your Knowledge: Logarithmic...Ch. 4 - Statistical Literacy Suppose the scatter diagram...Ch. 4 - Critical Thinking Suppose you and a friend each...Ch. 4 - Statistical Literacy When using the least-squares...Ch. 4 - StatisticalLiteracy Suppose that for x = 3. the...Ch. 4 - In Problems 9-14, (a) Draw a scatter diagram for...Ch. 4 - In Problems 9-14, (a) Draw a scatter diagram for...Ch. 4 - In Problems 9-14, (a) Draw a scatter diagram for...Ch. 4 - In Problems 9-14, (a) Draw a scatter diagram for...Ch. 4 - In Problems 9-14, (a) Draw a scatter diagram for...Ch. 4 - In Problems 9-14, (a) Draw a scatter diagram for...Ch. 4 - Prob. 1UTACh. 4 - Prob. 2UTACh. 4 - Prob. 3UTACh. 4 - Prob. 4UTACh. 4 - The data in this section are taken from this...Ch. 4 - The data in this section are taken from this...
Knowledge Booster
Background pattern image
Statistics
Learn more about
Need a deep-dive on the concept behind this application? Look no further. Learn more about this topic, statistics and related others by exploring similar questions and additional content below.
Similar questions
SEE MORE QUESTIONS
Recommended textbooks for you
Text book image
Glencoe Algebra 1, Student Edition, 9780079039897...
Algebra
ISBN:9780079039897
Author:Carter
Publisher:McGraw Hill
Text book image
Big Ideas Math A Bridge To Success Algebra 1: Stu...
Algebra
ISBN:9781680331141
Author:HOUGHTON MIFFLIN HARCOURT
Publisher:Houghton Mifflin Harcourt
Text book image
Elementary Linear Algebra (MindTap Course List)
Algebra
ISBN:9781305658004
Author:Ron Larson
Publisher:Cengage Learning
Text book image
Holt Mcdougal Larson Pre-algebra: Student Edition...
Algebra
ISBN:9780547587776
Author:HOLT MCDOUGAL
Publisher:HOLT MCDOUGAL
Correlation Vs Regression: Difference Between them with definition & Comparison Chart; Author: Key Differences;https://www.youtube.com/watch?v=Ou2QGSJVd0U;License: Standard YouTube License, CC-BY
Correlation and Regression: Concepts with Illustrative examples; Author: LEARN & APPLY : Lean and Six Sigma;https://www.youtube.com/watch?v=xTpHD5WLuoA;License: Standard YouTube License, CC-BY