In a January 15, 1998, article, the New England Journal of Medicine (338:141–146) reported on the utility of using computerized tomography (CT) as a diagnostic test for patients with clinically suspected appendicitis. In at least 20% of patients with appendicitis, the correct diagnosis was not made. On the other hand, the appendix was normal in 15% to 40% of patients who under- went emergency appendectomy. A study was designed to determine the prospective effectiveness of using CT as a diagnostic test to improve the treatment of these patients. The study examined 100 consecutive patients suspected of having acute appendicitis who presented to the emergency department or were referred there from a physician’s office. The 100 patients underwent a CT scan, and the surgeon made an assessment of the presence of appendicitis for each of the patients. The final clinical outcomes were determined at surgery and by pathological examination of the appendix after appendectomy or by clinical follow-up at least 2 months after CT scanning. The 1996 rate of occurrence of appendicitis was approximately P ( C ) − .00108. a. Find the sensitivity and specificity of the radiological determination of appendicitis. b. Find the probability that a patient truly had appendicitis given that the radiological determination was definitely appendicitis (DA). c. Find the probability that a patient truly did not have appendicitis given that the radiological determination was definitely appendicitis (DA). d. Find the probability that a patient truly did not have appendicitis given that the radiological determination was definitely not appendicitis (DNA).
In a January 15, 1998, article, the New England Journal of Medicine (338:141–146) reported on the utility of using computerized tomography (CT) as a diagnostic test for patients with clinically suspected appendicitis. In at least 20% of patients with appendicitis, the correct diagnosis was not made. On the other hand, the appendix was normal in 15% to 40% of patients who under- went emergency appendectomy. A study was designed to determine the prospective effectiveness of using CT as a diagnostic test to improve the treatment of these patients. The study examined 100 consecutive patients suspected of having acute appendicitis who presented to the emergency department or were referred there from a physician’s office. The 100 patients underwent a CT scan, and the surgeon made an assessment of the presence of appendicitis for each of the patients. The final clinical outcomes were determined at surgery and by pathological examination of the appendix after appendectomy or by clinical follow-up at least 2 months after CT scanning. The 1996 rate of occurrence of appendicitis was approximately P ( C ) − .00108. a. Find the sensitivity and specificity of the radiological determination of appendicitis. b. Find the probability that a patient truly had appendicitis given that the radiological determination was definitely appendicitis (DA). c. Find the probability that a patient truly did not have appendicitis given that the radiological determination was definitely appendicitis (DA). d. Find the probability that a patient truly did not have appendicitis given that the radiological determination was definitely not appendicitis (DNA).
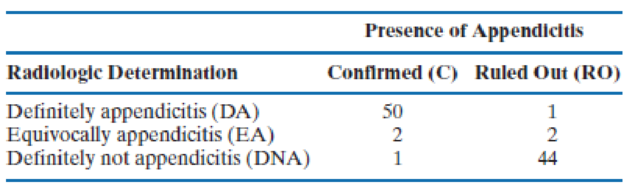
In a January 15, 1998, article, the New England Journal of Medicine (338:141–146) reported on the utility of using computerized tomography (CT) as a diagnostic test for patients with clinically suspected appendicitis. In at least 20% of patients with appendicitis, the correct diagnosis was not made. On the other hand, the appendix was normal in 15% to 40% of patients who under- went emergency appendectomy. A study was designed to determine the prospective effectiveness of using CT as a diagnostic test to improve the treatment of these patients. The study examined 100 consecutive patients suspected of having acute appendicitis who presented to the emergency department or were referred there from a physician’s office. The 100 patients underwent a CT scan, and the surgeon made an assessment of the presence of appendicitis for each of the patients. The final clinical outcomes were determined at surgery and by pathological examination of the appendix after appendectomy or by clinical follow-up at least 2 months after CT scanning.
The 1996 rate of occurrence of appendicitis was approximately P(C) − .00108.
a. Find the sensitivity and specificity of the radiological determination of appendicitis.
b. Find the probability that a patient truly had appendicitis given that the radiological determination was definitely appendicitis (DA).
c. Find the probability that a patient truly did not have appendicitis given that the radiological determination was definitely appendicitis (DA).
d. Find the probability that a patient truly did not have appendicitis given that the radiological determination was definitely not appendicitis (DNA).
The following are suggested designs for group sequential studies. Using PROCSEQDESIGN, provide the following for the design O’Brien Fleming and Pocock.• The critical boundary values for each analysis of the data• The expected sample sizes at each interim analysisAssume the standardized Z score method for calculating boundaries.Investigators are evaluating the success rate of a novel drug for treating a certain type ofbacterial wound infection. Since no existing treatment exists, they have planned a one-armstudy. They wish to test whether the success rate of the drug is better than 50%, whichthey have defined as the null success rate. Preliminary testing has estimated the successrate of the drug at 55%. The investigators are eager to get the drug into production andwould like to plan for 9 interim analyses (10 analyzes in total) of the data. Assume thesignificance level is 5% and power is 90%.Besides, draw a combined boundary plot (OBF, POC, and HP)
Please provide the solution for the attached image in detailed.
20 km, because
GISS
Worksheet 10
Jesse runs a small business selling and delivering mealie meal to the spaza shops.
He charges a fixed rate of R80, 00 for delivery and then R15, 50 for each packet of
mealle meal he delivers. The table below helps him to calculate what to charge
his customers.
10
20
30
40
50
Packets of mealie
meal (m)
Total costs in Rands
80
235
390
545
700
855
(c)
10.1.
Define the following terms:
10.1.1. Independent Variables
10.1.2. Dependent Variables
10.2.
10.3.
10.4.
10.5.
Determine the independent and dependent variables.
Are the variables in this scenario discrete or continuous values? Explain
What shape do you expect the graph to be? Why?
Draw a graph on the graph provided to represent the information in the
table above.
TOTAL COST OF PACKETS OF MEALIE MEAL
900
800
700
600
COST (R)
500
400
300
200
100
0
10
20
30
40
60
NUMBER OF PACKETS OF MEALIE MEAL
Chapter 4 Solutions
An Introduction to Statistical Methods and Data Analysis
Need a deep-dive on the concept behind this application? Look no further. Learn more about this topic, statistics and related others by exploring similar questions and additional content below.
Introduction to experimental design and analysis of variance (ANOVA); Author: Dr. Bharatendra Rai;https://www.youtube.com/watch?v=vSFo1MwLoxU;License: Standard YouTube License, CC-BY


 Glencoe Algebra 1, Student Edition, 9780079039897...AlgebraISBN:9780079039897Author:CarterPublisher:McGraw Hill
 College Algebra (MindTap Course List)AlgebraISBN:9781305652231Author:R. David Gustafson, Jeff HughesPublisher:Cengage Learning