Concept explainers
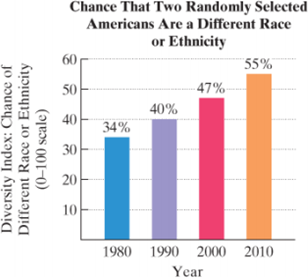
Diversity Index. What is the chance that the next person I meet will be different from me? The diversity index, from 0 (no diversity) to 100, measures the chance that two randomly selected people are a different race or ethnicity. The diversity index in the United States varies widely from region to region, from as high as 81 in Hawaii to as low as 11 in Vermont. The bar graph at the top of the next column shows the national diversity index for the United States for four years in the period from 1980 through 2010. Exercises 55 –56are based on the data on the graph.

The data in the graph can be modeled by the formula
where D is the national diversity index for the United States x years after 1980.
a. How well does the formula model the national diversity index for 2010?
b. Use an inequality to determine in which years the national diversity index will exceed 62.
Want to see the full answer?
Check out a sample textbook solution
Chapter 4 Solutions
Intermediate Algebra for College Students (7th Edition)
- 1 4 5 Question 3. Find A-1 (if exists), where A = -3 -1 -2 2 3 4 Question 4. State 4 equivalent conditions for a matrix A to be nonsingulararrow_forwardHow long is a guy wire reaching from the top of a 15-foot pole to a point on the ground 9-feet from the pole? Question content area bottom Part 1 The guy wire is exactly feet long. (Type an exact answer, using radicals as needed.) Part 2 The guy wire is approximatelyfeet long. (Round to the nearest thousandth.)arrow_forwardQuestion 6 Not yet answered Marked out of 5.00 Flag question = If (4,6,-11) and (-12,-16,4), = Compute the cross product vx w karrow_forward
- Consider the following vector field v^-> (x,y): v^->(x,y)=2yi−xj What is the magnitude of the vector v⃗ located in point (13,9)? [Provide your answer as an integer number (no fraction). For a decimal number, round your answer to 2 decimal places]arrow_forwardQuestion 4 Find the value of the first element for the first row of the inverse matrix of matrix B. 3 Not yet answered B = Marked out of 5.00 · (³ ;) Flag question 7 [Provide your answer as an integer number (no fraction). For a decimal number, round your answer to 2 decimal places] Answer:arrow_forwardQuestion 2 Not yet answered Multiply the following Matrices together: [77-4 A = 36 Marked out of -5 -5 5.00 B = 3 5 Flag question -6 -7 ABarrow_forward
- Assume {u1, U2, u3, u4} does not span R³. Select the best statement. A. {u1, U2, u3} spans R³ if u̸4 is a linear combination of other vectors in the set. B. We do not have sufficient information to determine whether {u₁, u2, u3} spans R³. C. {U1, U2, u3} spans R³ if u̸4 is a scalar multiple of another vector in the set. D. {u1, U2, u3} cannot span R³. E. {U1, U2, u3} spans R³ if u̸4 is the zero vector. F. none of the abovearrow_forwardSelect the best statement. A. If a set of vectors includes the zero vector 0, then the set of vectors can span R^ as long as the other vectors are distinct. n B. If a set of vectors includes the zero vector 0, then the set of vectors spans R precisely when the set with 0 excluded spans Rª. ○ C. If a set of vectors includes the zero vector 0, then the set of vectors can span Rn as long as it contains n vectors. ○ D. If a set of vectors includes the zero vector 0, then there is no reasonable way to determine if the set of vectors spans Rn. E. If a set of vectors includes the zero vector 0, then the set of vectors cannot span Rn. F. none of the abovearrow_forwardWhich of the following sets of vectors are linearly independent? (Check the boxes for linearly independent sets.) ☐ A. { 7 4 3 13 -9 8 -17 7 ☐ B. 0 -8 3 ☐ C. 0 ☐ D. -5 ☐ E. 3 ☐ F. 4 THarrow_forward
- 3 and = 5 3 ---8--8--8 Let = 3 U2 = 1 Select all of the vectors that are in the span of {u₁, u2, u3}. (Check every statement that is correct.) 3 ☐ A. The vector 3 is in the span. -1 3 ☐ B. The vector -5 75°1 is in the span. ГОЛ ☐ C. The vector 0 is in the span. 3 -4 is in the span. OD. The vector 0 3 ☐ E. All vectors in R³ are in the span. 3 F. The vector 9 -4 5 3 is in the span. 0 ☐ G. We cannot tell which vectors are i the span.arrow_forward(20 p) 1. Find a particular solution satisfying the given initial conditions for the third-order homogeneous linear equation given below. (See Section 5.2 in your textbook if you need a review of the subject.) y(3)+2y"-y-2y = 0; y(0) = 1, y'(0) = 2, y"(0) = 0; y₁ = e*, y2 = e¯x, y3 = e−2x (20 p) 2. Find a particular solution satisfying the given initial conditions for the second-order nonhomogeneous linear equation given below. (See Section 5.2 in your textbook if you need a review of the subject.) y"-2y-3y = 6; y(0) = 3, y'(0) = 11 yc = c₁ex + c2e³x; yp = −2 (60 p) 3. Find the general, and if possible, particular solutions of the linear systems of differential equations given below using the eigenvalue-eigenvector method. (See Section 7.3 in your textbook if you need a review of the subject.) = a) x 4x1 + x2, x2 = 6x1-x2 b) x=6x17x2, x2 = x1-2x2 c) x = 9x1+5x2, x2 = −6x1-2x2; x1(0) = 1, x2(0)=0arrow_forwardFind the perimeter and areaarrow_forward
 Holt Mcdougal Larson Pre-algebra: Student Edition...AlgebraISBN:9780547587776Author:HOLT MCDOUGALPublisher:HOLT MCDOUGAL
 Glencoe Algebra 1, Student Edition, 9780079039897...AlgebraISBN:9780079039897Author:CarterPublisher:McGraw Hill
 Big Ideas Math A Bridge To Success Algebra 1: Stu...AlgebraISBN:9781680331141Author:HOUGHTON MIFFLIN HARCOURTPublisher:Houghton Mifflin Harcourt
 College Algebra (MindTap Course List)AlgebraISBN:9781305652231Author:R. David Gustafson, Jeff HughesPublisher:Cengage Learning
 Functions and Change: A Modeling Approach to Coll...AlgebraISBN:9781337111348Author:Bruce Crauder, Benny Evans, Alan NoellPublisher:Cengage Learning


