(a)
To explain: The type of angled formed when a vertical line is drawn at any point on the graph.
(a)
Answer to Problem 54PPS
The
Explanation of Solution
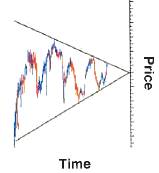
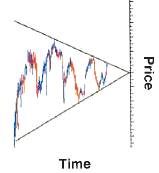
Given information: The given chart is given below.

Both lines represent highs and lows of a stock converging on the same price. The top side would be a reflection of the bottom side as triangle is symmetrical. Hence, both segments are congruent and triangle is isosceles. The
Therefore, the triangle is acute.
(b)
To find: The pattern of price fluctuation for the data to obtuse an obtuse triangle.
(b)
Explanation of Solution
Given information: The given chart is given below.

The difference between high and low prices of stock is known as fluctuation. If it decreases quickly over a short time of period then, it will form an obtuse angle, as shown in following diagram.

Chapter 4 Solutions
Geometry, Student Edition
Additional Math Textbook Solutions
Elementary Statistics (13th Edition)
Thinking Mathematically (6th Edition)
Intro Stats, Books a la Carte Edition (5th Edition)
Calculus: Early Transcendentals (2nd Edition)
A Problem Solving Approach To Mathematics For Elementary School Teachers (13th Edition)
Calculus: Early Transcendentals (2nd Edition)
- Can someone help me with this please?arrow_forwardMariela is in her classroom and looking out of a window at a tree, which is 20 feet away. Mariela’s line of sight to the top of the tree creates a 42° angle of elevation, and her line of sight to the base of the tree creates a 31° angle of depression. What is the height of the tree, rounded to the nearest foot? Be sure to show your work to explain how you got your answer.arrow_forward1arrow_forward
 Elementary Geometry For College Students, 7eGeometryISBN:9781337614085Author:Alexander, Daniel C.; Koeberlein, Geralyn M.Publisher:Cengage,
 Elementary Geometry for College StudentsGeometryISBN:9781285195698Author:Daniel C. Alexander, Geralyn M. KoeberleinPublisher:Cengage Learning

