
Videos
Use the technique that we used in Example 7 to do Exercises 51–54. We do not list duplicate information in the tables.
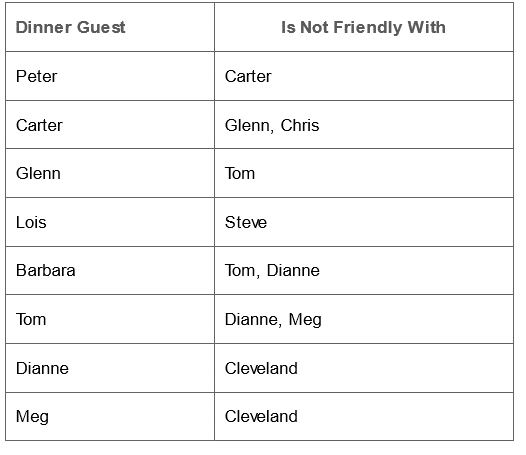
Avoiding Conflicts. The Griffins are looking forward to a “Family Guy” wedding, but there is concern about the impending rehearsal dinner because certain people invited to the dinner just don’t get along with each other. Therefore, it is important that people who are not friendly be seated at different tables. Use the information in the table to determine a satisfactory seating arrangement for the dinner using as few tables as possible.
Example 7 Using a Graph Theory Model to Schedule Committees
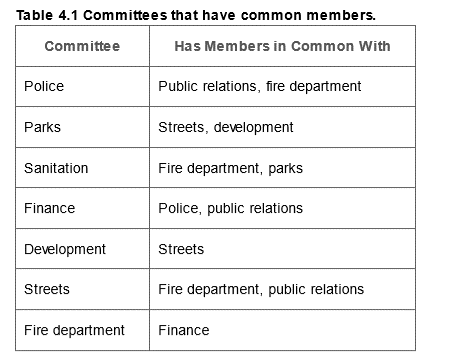
Each member of a city council usually serves on several committees to oversee the operation of various aspects of city government. Assume that council members serve on the following committees: police, parks, sanitation, finance, development, streets, fire department, and public relations. Use Table 4.1, which lists committees having common members, to determine a conflict-free schedule for the meetings. We do not duplicate information in Table 4.1. That is, because police conflicts with fire department, we do not also list that fire department conflicts with police.
Solution: Recall that in building a graph model, we must have two things:
A set of objects—in this case, the set of committees.1. A relationship among the objects. We will say that two committees are related if the two committees have members in common. So we can model the information in Table 4.1 by the graph in Figure 4.19.
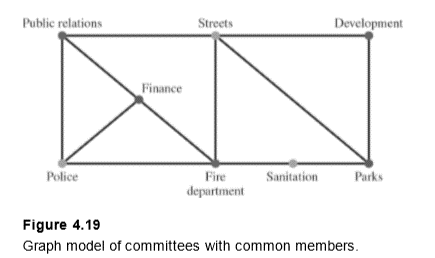
This problem is similar to the map-coloring problem. If we color this graph, then all vertices having the same color represent committees that can meet at the same time. We show one possible coloring of the graph in Figure 4.1.
From Figure 4.19, we see that the police, streets, and sanitation committees have no common members and therefore can meet at the same time. Public relations, development, and the fire department can meet at a second time. Finance and parks can meet at a third time.
Want to see the full answer?
Check out a sample textbook solution
Chapter 4 Solutions
MYLAB MATH WITH PEARSON ETEXT FOR MATHEM


- Find the volume of the figure. The volume of the figure is 3 m 3 m 3 marrow_forwardFind the circumference and area of the circle. Express answers in terms of and then round to the nearest tenth. Find the circumference in terms of C= (Type an exact answer in terms of x.) Find the circumference rounded to the nearest tenth. C= Find the area in terms of A= (Type an exact answer in terms of x.) Find the area rounded to the nearest tenth. A= 10 cmarrow_forwardSox & Sin (px) dx 0arrow_forward
- In Exercises 62-64, sketch a reasonable graph that models the given situation. The number of hours of daylight per day in your hometown over a two-year period The motion of a diving board vibrating 10 inches in each direction per second just after someone has dived off The distance of a rotating beam of light from a point on a wallarrow_forward8 L 8 e ipx dxarrow_forwardThe manager of a fleet of automobiles is testing two brands of radial tires and assigns one tire of each brand at random to the two rear wheels of eight cars and runs the cars until the tires wear out. The data (in kilometers) follow. CAR BRAND1 BRAND2 DIFFERENCE = (BRAND1 - BF 1 36,925 33,018 3,907 2 45,300 43,280 2,020 3 36,240 35,500 740 4 32,100 31,200 900 5 37,210 37,015 195 6 48,360 46,800 1,560 7 38,200 37,810 390 8 33,500 33,215 285arrow_forward
- Diabetes and obesity are serious health concerns in the United States and much of the developed world. Measuring the amount of body fat a person carries is one way to monitor weight control progress, but measuring it accurately involves either expensive X-ray equipment or a pool in which to dunk the subject. Instead body mass index (BMI) is often used as a proxy for body fat because it is easy to measure: BMI = mass(kg)/(height(m))² = 703 mass(lb)/(height(in))². In a study of 15 men at TXST, both BMI and body fat were measured. Researchers imported the data into statistical software for analysis. A few values are missing from the output. Complete the table by filling in the missing values. Model Summary S R-sq % (three decimal places) (two decimal places. e.g. 12.3456%, enter 12.35) Analysis of Variance Source Model Error Total DF SS MS F P 17.600 0.001 DF: whole numbers SS or MS; three decimal places 34.810 Does a simple linear regression model seem reasonable in this situation?…arrow_forwardThe use of electromyostimulation (EMS) as a method to train healthy skeletal muscle is studied. EMS sessions consisted of 30 contractions (4-second duration, 85 Hz) and were carried out three times per week for three weeks on 17 ice hockey players. The 10-meter skating performance test showed a standard deviation of 0.90 seconds. Is there strong evidence to conclude that the standard deviation of performance time exceeds the historical value of 0.75 seconds? Use a = 0.05.arrow_forwardOne-Sample Z Test Test of М = 45 vs not === 45 The assumed standard deviation = 2.8 VARIABLE N MEAN STDEV SE MEAN X Instructions: 46.377 2.500 0.626 95% CI (,) Fill in the missing values. N: Round the answer to the nearest whole number. Cl: Round to three decimal places. Z: Round to two decimal places. P: Round to three decimal places.arrow_forward
- Need detailed report solution without AI and Chatgpt,arrow_forwardBased on the software output, write the fitted simple linear regression equation. Coefficients Term Coef SE Coef T-Value P-Value Constant 3.20 1.92 1.67 0.237 [Select] y= 0.600 0.566 1.06 0.400 +[Select] x Does a simple linear regression model seem reasonable in this situation? [Select]arrow_forward30.4. Suppose that f(2) has a pole of order m at zo. Show that f'(z) has a pole of order m + 1 at zo-arrow_forward
 Glencoe Algebra 1, Student Edition, 9780079039897...AlgebraISBN:9780079039897Author:CarterPublisher:McGraw Hill
 Algebra: Structure And Method, Book 1AlgebraISBN:9780395977224Author:Richard G. Brown, Mary P. Dolciani, Robert H. Sorgenfrey, William L. ColePublisher:McDougal Littell
 Big Ideas Math A Bridge To Success Algebra 1: Stu...AlgebraISBN:9781680331141Author:HOUGHTON MIFFLIN HARCOURTPublisher:Houghton Mifflin Harcourt
 Holt Mcdougal Larson Pre-algebra: Student Edition...AlgebraISBN:9780547587776Author:HOLT MCDOUGALPublisher:HOLT MCDOUGAL
 Mathematics For Machine TechnologyAdvanced MathISBN:9781337798310Author:Peterson, John.Publisher:Cengage Learning,