
Videos
Physics Experiment Consider a physics laboratory experiment designed to determine an unknown mass. A flexible metal meter stick is clamped to a table with 50 centimeters overhanging the edge (see figure). Known masses
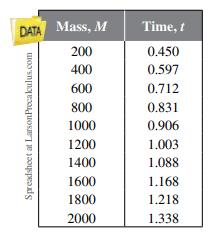

A model for the data that can be used to predict the time of one oscillation is
(a) Use this model to create a table showing the predicted time for each of the masses shown in the table above.
(b) Compare the predicted times with the experimental times. What can you conclude?
(c) Use the model to approximate the mass of an object for which

Trending nowThis is a popular solution!

Chapter 4 Solutions
College Algebra


- e). n! (n - 1)!arrow_forwardSuppose you flip a fair two-sided coin four times and record the result. a). List the sample space of this experiment. That is, list all possible outcomes that could occur when flipping a fair two-sided coin four total times. Assume the two sides of the coin are Heads (H) and Tails (T).arrow_forwarde). n! (n - 1)!arrow_forward
- Evaluate the following expression and show your work to support your calculations. a). 6! b). 4! 3!0! 7! c). 5!2! d). 5!2! e). n! (n - 1)!arrow_forwardAmy and Samiha have a hat that contains two playing cards, one ace and one king. They are playing a game where they randomly pick a card out of the hat four times, with replacement. Amy thinks that the probability of getting exactly two aces in four picks is equal to the probability of not getting exactly two aces in four picks. Samiha disagrees. She thinks that the probability of not getting exactly two aces is greater. The sample space of possible outcomes is listed below. A represents an ace, and K represents a king. Who is correct?arrow_forwardConsider the exponential function f(x) = 12x. Complete the sentences about the key features of the graph. The domain is all real numbers. The range is y> 0. The equation of the asymptote is y = 0 The y-intercept is 1arrow_forward
- The graph shows Alex's distance from home after biking for x hours. What is the average rate of change from -1 to 1 for the function? 4-2 о A. -2 О B. 2 О C. 1 O D. -1 ty 6 4 2 2 0 X 2 4arrow_forwardWrite 7. √49 using rational exponents. ○ A. 57 47 B. 7 O C. 47 ○ D. 74arrow_forwardCan you check If my short explantions make sense because I want to make sure that I describe this part accuratelyarrow_forward
 Algebra & Trigonometry with Analytic GeometryAlgebraISBN:9781133382119Author:SwokowskiPublisher:Cengage
 Mathematics For Machine TechnologyAdvanced MathISBN:9781337798310Author:Peterson, John.Publisher:Cengage Learning,
 College AlgebraAlgebraISBN:9781305115545Author:James Stewart, Lothar Redlin, Saleem WatsonPublisher:Cengage Learning
 Algebra and Trigonometry (MindTap Course List)AlgebraISBN:9781305071742Author:James Stewart, Lothar Redlin, Saleem WatsonPublisher:Cengage Learning