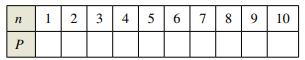
Psychologists have developed mathematical models to predict memory performance as a function of the number of trials n of a certain task. Consider the learning curve P = 0.5 + 0.9 ( n − 1 ) 1 + 0.9 ( n − 1 ) , n > 0 where p is the fraction of correct responses after n trials. (a) Complete the table for this model. What does it suggest? (b) According to the model, what is the limiting percent of correct responses as n increases?
Psychologists have developed mathematical models to predict memory performance as a function of the number of trials n of a certain task. Consider the learning curve P = 0.5 + 0.9 ( n − 1 ) 1 + 0.9 ( n − 1 ) , n > 0 where p is the fraction of correct responses after n trials. (a) Complete the table for this model. What does it suggest? (b) According to the model, what is the limiting percent of correct responses as n increases?
Solution Summary: The author explains that P is the tion of correct responses after n trials.
Psychologists have developed mathematical models to predict memory performance as a function of the number of trials
n
of a certain task. Consider the learning curve
P
=
0.5
+
0.9
(
n
−
1
)
1
+
0.9
(
n
−
1
)
,
n
>
0
where
p
is the fraction of correct responses after
n
trials.
(a) Complete the table for this model. What does it suggest?
(b) According to the model, what is the limiting percent of correct responses as
n
increases?
A research study in the year 2009 found that there were 2760 coyotes
in a given region. The coyote population declined at a rate of 5.8%
each year.
How many fewer coyotes were there in 2024 than in 2015?
Explain in at least one sentence how you solved the problem. Show
your work. Round your answer to the nearest whole number.
Answer the following questions related to the following matrix
A =
3
³).
Need a deep-dive on the concept behind this application? Look no further. Learn more about this topic, algebra and related others by exploring similar questions and additional content below.
Correlation Vs Regression: Difference Between them with definition & Comparison Chart; Author: Key Differences;https://www.youtube.com/watch?v=Ou2QGSJVd0U;License: Standard YouTube License, CC-BY
Correlation and Regression: Concepts with Illustrative examples; Author: LEARN & APPLY : Lean and Six Sigma;https://www.youtube.com/watch?v=xTpHD5WLuoA;License: Standard YouTube License, CC-BY


 Glencoe Algebra 1, Student Edition, 9780079039897...AlgebraISBN:9780079039897Author:CarterPublisher:McGraw Hill
 Big Ideas Math A Bridge To Success Algebra 1: Stu...AlgebraISBN:9781680331141Author:HOUGHTON MIFFLIN HARCOURTPublisher:Houghton Mifflin Harcourt
 Holt Mcdougal Larson Pre-algebra: Student Edition...AlgebraISBN:9780547587776Author:HOLT MCDOUGALPublisher:HOLT MCDOUGAL