Concept explainers
Psychologists have developed mathematical models to predict memory performance as a function of the number of trials
where
(a) Complete the table for this model. What does it suggest?
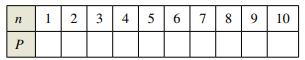
(b) According to the model, what is the limiting percent of correct responses as
Trending nowThis is a popular solution!
Chapter 4 Solutions
EBK COLLEGE ALGEBRA
- NEW STUDY: Dr. Apnea conducted a study investigating the effects of sleep deprivation on complex problem solving. He gave 25 college students a problem-solving test at noon on one day and a second problem-solving test at noon the following day. He found that there was a statistically significant mean decrease of 4.7 between the two tests from the first day to the second day. The test yielded a Cohen’s d = .82. Which of the following statements is an accurate interpretation of Dr. Apnea’s research? Group of answer choices It doesn’t matter how much sleep you get, some people just aren’t good at problem solving. If you don’t get enough sleep your problem solving abilities suffer, but only with a small absolute magnitude. If you don’t get enough sleep your problem solving abilities suffer with a medium absolute magnitude. If you don’t get enough sleep your problem solving abilities suffer with a large absolute magnitude.arrow_forwardHow profitable are different sectors of the stock market? One way to answer such a question is to examine profit as a percentage of stockholder equity. A random sample of 32 retail stocks was studied for x1, profit as a percentage of stockholder equity. The result was x1 = 13.2. A random sample of 33 utility (gas and electric) stocks was studied for x2, profit as a percentage of stockholder equity. The result was x2 = 10.0. Assume ?1 = 4.2 and ?2 = 2.6. Note: For degrees of freedom d.f. not in the Student's t table, use the closest d.f. that is smaller. In some cases, this choice will increase the P-value by a small amount or increase the length of the confidence interval, thereby making the answer slightly more "conservative." (a) Let ?1 represent the population mean profit as a percentage of stockholder equity for retail stocks, and let ?2 represent the population mean profit as a percentage of stockholder equity for utility stocks. Find a 95% confidence interval for ?1 − ?2.…arrow_forward(c) Perform a regression analysis with x1 as the response variable. Use x2, x3, x4, x5, and x6 as explanatory variables. Look at the coefficient of multiple determination. What percentage of the variation in x1 can be explained by the corresponding variations in x2, x3, x4, x5, and x6 taken together? (Use 1 decimal place.)%(d) Write out the regression equation. (Use 2 decimal places for x3 and x6. Use 1 decimal place otherwise.) x1 = + x2 + x3 + x4 + x5 + x6 If 11 new competing stores moved into the sales district but the other explanatory variables did not change, what would you expect for the corresponding change in annual net sales? (Use 2 decimal places.)If you increased the local advertising by 8 thousand dollars but the other explanatory variables did not change, what would you expect for the corresponding change in annual net sales? (Use 2 decimal places.)(e) Test each coefficient to determine if it is or is not zero. Use a 5% level of significance. (Use 2 decimal places…arrow_forward
- The following table gives estimates of the percent of a certain country's population below the poverty level for 1998–2008. Year Percent 1998 12.8 2000 11.2 2002 12.1 2004 12.7 2006 12.9 2008 13.2 Find the least squares line that relates years to percent below the poverty level. (Let x = 0 represent the year 1998. Enter a mathematical expression.arrow_forwardTwo manufacturing companies of soap each claims that their product is superior in whitening one’s complexion. A researcher did an experiment by randomly choosing two groups and assigning each group to use the product for one month. Results are shown below where the higher the number, the more effective the product in skin whitening. At (t-tabular value is ) level, is there a significant difference between the two products effectiveness in skin whitening? Product (Soap A or B) A 10 12 13 13 15 15 15 17 18 24 25 25 25 27 28 30 30 B 8 9 11 15 16 16 16 19 20 21 25 25 26 28 29 30 30 32 33 33arrow_forward(d) What percentage of the variation in diastolic blood pressure can be explained by systolic blood pressure? (e) Find an equation of the least-squares regression line for systolic blood pressure and diastolic blood pressure. A blood pressure measurement consists of two numbers: the systolic pressure, which is the maximum pressure taken when the heart is contracting, and the diastolic pressure, which is the minimum pressure taken at the beginning of the heartbeat. Blood pressures taken at rest were measured, in millimeters, for a sample of 15 adults. The following table presents the results. 130 116 133 112 107 110 105 157 154 Systolic Diastolic 134 115 113 123 119 118 87 83 77 77 69 88 76 70 91 75 71 74 66 103 94 Below is a scatterplot of the data set.arrow_forward
- An agricultural field trial compares the yield of two varieties of corn. The researchers divide in half each of 17 fields of land in different locations and plant each corn variety in one half of each plot. After harvest, the yields are compared in bushels per acre at each location. The 17 differences (Variety A - Variety B) give a = 2.81 and s = 2.85. Does this sample provide evidence that Variety A had a higher yield than Variety B? (a) State the null and alternative hypotheses: (Type "mu" for the symbol u , e.g. mu > 1 for the mean is greater than 1, mu < 1 for the mean is less than 1, mu not = 1 for the mean is not equal to 1) Но : На : (b) Find the standardized test statistic, t = (c) Answer the question: Does this sample provide evidence that Variety A had a higher yield than Variety B? (Use a 5% level of significance) (Type: Yes or No)arrow_forwardAn agricultural field trial compares the yield of two varieties of corn. The researchers divide in half each of 8 fields of land in different locations and plant each corn variety in one half of each plot. After harvest, the yields are compared in bushels per acre at each location. The 8 differences (Variety A - Variety B) give ī = 3.28 and s = 2.14. Does this sample provide evidence that Variety A had a higher yield than Variety B? (a) State the null and alternative hypotheses: (Type "mu" for the symbol u , e.g. mu >1 for the mean is greater than 1, mu <1 for the mean is less than 1, mu not = 1 for the mean is not equal to 1) Ho : 0 Ha : 0 (b) Find the test statistic, t = (C) Answer the question: Does this sample provide evidence that Variety A had a higher yield than Variety B? (Use a 5% level of significance) (Type: Yes or No)arrow_forwardAn agricultural field trial compares the yield of two varieties of corn. The researchers divide in half each of 8 fields of land in different locations and plant each corn variety in one half of each plot. After harvest, the yields are compared in bushels per acre at each location. The 8 differences (Variety A - Variety B) give x¯=3.07 and s=5.11. Does this sample provide evidence that Variety A had a higher yield than Variety B? (a) State the null and alternative hypotheses: (Type "mu" for the symbol μμ , e.g. mu > 1 for the mean is greater than 1, mu < 1 for the mean is less than 1, mu not = 1 for the mean is not equal to 1)H0 : Ha : (b) Find the test statistic, t = 7,6arrow_forward
- Frankenstein has conducted a study to see if children who “can’t say something nice” (group A) get more candy than children who “don’t say nothing at all” (group B). He observed that, on average, group A gets 19 pieces and group B gets 23 pieces. Dr. Frankenstein then ran a t-test, in which he found t(20) = 2.536. How should Dr. Frankenstein interpret his findings? (Hint: It may help to look at how t-scores are reported in APA format.)arrow_forward(d): Your answer is incorrect. The owner of a chain of mini-markets wants to compare the sales performance of two of her stores, Store 1 and Store 2. Sales can vary considerably depending on the day of the week and the season of the year, so she decides to eliminate such effects by making sure to record each store's sales on the same 8 days, chosen at random. She records the sales (in dollars) for each store on these days, as shown in the table below. Day 1 2 3 4 5 6 7 8 Store 1 1000 817 351 1 991 547 802 808 996 Store 2 722 775 78 930 407 605 416 944 Difference 278 42 273 19 61 140 197 392 52 (Store 1 - Store 2) Send data to calculator く Based on these data, can the owner conclude, at the 0.05 level of significance, that the mean daily sales of the two stores differ? Answer this question by performing a hypothesis test regarding Ha (which is μ with a letter "d" subscript), the population mean daily sales difference between the two stores. Assume that this population of differences…arrow_forwardThe least-squares regression equation is y=728.0x+14,705 where y is the median income and x is the percentage of 25 years and older with at least a bachelor's degree in the region. The scatter diagram indicates a linear relation between the two variables with a correlation coefficient of 0.8165. For every dollar increase in median income, the percent of adults having at least a bachelor's degree is ___%, on average. For a median income of $0, the percent of adults with a bachelor's degree is ____%.arrow_forward
- Glencoe Algebra 1, Student Edition, 9780079039897...AlgebraISBN:9780079039897Author:CarterPublisher:McGraw HillHolt Mcdougal Larson Pre-algebra: Student Edition...AlgebraISBN:9780547587776Author:HOLT MCDOUGALPublisher:HOLT MCDOUGALBig Ideas Math A Bridge To Success Algebra 1: Stu...AlgebraISBN:9781680331141Author:HOUGHTON MIFFLIN HARCOURTPublisher:Houghton Mifflin Harcourt