Videos
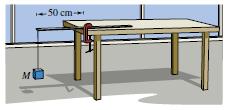
Physics Experiment Consider a physics laboratory experiment designed to determine an unknown mass. A flexible metal meter stick is clamped to a table with 50 centimeters overhanging the edge (see figure). Known masses
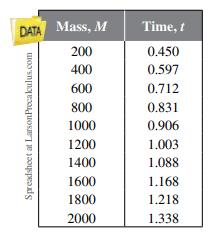
A model for the data that can be used to predict the time of one oscillation is
(a) Use this model to create a table showing the predicted time for each of the masses shown in the table above.
(b) Compare the predicted times with the experimental times. What can you conclude?
(c) Use the model to approximate the mass of an object for which

Trending nowThis is a popular solution!

Chapter 4 Solutions
EBK COLLEGE ALGEBRA


- 2. Find the exact value of 12 + 12+12+√√12+ √12+ 12arrow_forwardTechnetium-99m is used as a radioactive tracer for certain medical tests. It has a half-life of 1 day. Consider the function TT where T(d)T(d) =100(2)−d=100(2)−d is the percent of Technetium-99m remaining dd days after the test. Which expression represents the number of days until only 5% remains?arrow_forward1. Find the inverse of f(x) = = 2x 1+2x Then find the domain of the inverse.arrow_forward
- Let S = be a set of k vectors in R^, with karrow_forwarda) [1√2-31x+1√3-11y = x (1 - √2) + √34 LI√2-21x-1√3-3/4= √34 - √2x-4arrow_forwardPlease Help me answer this linear algebra question. This is a practice textbook question.arrow_forward1. a scientist observed a bacterium in a microscope. it measured about .0000029 meter in diameter which of the following is closest to it? A- 2 x 10^-6, B- 2 x 10^-5, C- 3 x 10^-5, or D- 3 x 10^-6 2.express the product of 500 and 400 in scientific notation. is it 2 x 10^5 or 2 x 10^4 or 2 x 10^3 or 20 x 10^4arrow_forwardPlease Help me answer this linear algebra question. This is a practice textbook question.arrow_forwardPlease Help me answer this linear algebra question. This is a practice textbook question.arrow_forwardTY D om E h om ng 00 C B A G F Q ו 3 13 Details Find an Euler path for the graph. Enter your response as a sequence of vertices in the order they are visited, for example, ABCDEA. fic ► Question Help: Video Message instructor Submit Question tor arch 園 A Wind advisoryarrow_forwardYou are provided with three 2D data points, p1, p2 and p3. Solving A C = B for C provides youwith the coefficients of a natural cubic spline curve that interpolates these points.Additionally, you have been given A and B, but some elements are missing. Moreover, the last two rowsof A are entirely absent. Your task is to determine and fill in the missing elements. For the last two rows,enforce a zero tangent at the beginning (in p1) and a not-a-knot boundary condition in p2. The matricesA and B are given as follows:Explain how to find the entries of A and B . How would you adapt these matrices if the data pointswere 3D? What if your spline should go through five data points? How many “extra rows” would there thenbe (with “extra” meaning “in addition to securing C2-continuity”)?arrow_forwardWhich graph represents f(x) = √x-2+3?arrow_forwardarrow_back_iosSEE MORE QUESTIONSarrow_forward_ios
 Algebra & Trigonometry with Analytic GeometryAlgebraISBN:9781133382119Author:SwokowskiPublisher:Cengage
 Mathematics For Machine TechnologyAdvanced MathISBN:9781337798310Author:Peterson, John.Publisher:Cengage Learning,
 College AlgebraAlgebraISBN:9781305115545Author:James Stewart, Lothar Redlin, Saleem WatsonPublisher:Cengage Learning
 Algebra and Trigonometry (MindTap Course List)AlgebraISBN:9781305071742Author:James Stewart, Lothar Redlin, Saleem WatsonPublisher:Cengage Learning