
Concept explainers
Videos
a)
To find: The total number of minutes used in a month by a family with 18 years, 19 years and by two 37-55 years old members.
a)
Answer to Problem 30PPS
Total number of minutes used in a month by the said age group used be 4060 minutes.
Explanation of Solution
Given information: Following double bar graph that shows average monthly cell phone uses by the users of different age groups:
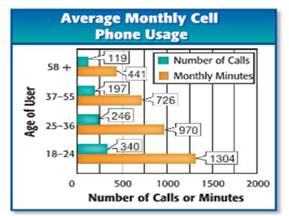
Concept used: For monthly calls, orange color bars heights will be observed and for number of calls, green color bars heights will be observed with their related given values.
Calculation: In 18-24 years group, number of minutes used be 1304, and for 37-55 age group, it is 726, so for one 18 years, one 19 years and two 37-55 age group user, total minutes used :
Conclusion: By above calculation, it is concluded that total desired minutes used in a month be 4060 minutes by the said users. Total calls made by said users in three months be 3516 and age group 18-24 years, made the maximum number of monthly calls.
b)
To find: Total number of calls made in three months by two 20 years and two 30 years olds.
b)
Answer to Problem 30PPS
Total number of calls made in three months by given persons be 3516 calls.
Explanation of Solution
Given information: Following double bar graph that shows average monthly cell phone uses by the users of different age groups:
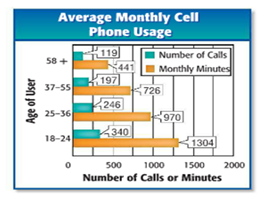
Concept used: For monthly calls, orange color bars heights will be observed and for number of calls, green color bars heights will be observed with their related given values.
Calculation : For a 20 years old use, monthly number of calls are 340, for a 30 years old, it is 246 calls per month, so for two 20 years old and two 30 years old user, total calls for three months be :
Conclusion: By above calculation, it is concluded that total calls made by said users in three months be 3516 .
c)
To find: The group, that placed maximum monthly calls.
c)
Answer to Problem 30PPS
Age group 18-24 user made the maximum average 340 calls in a month.
Explanation of Solution
Given information: Following double bar graph that shows average monthly cell phone uses by the users of different age groups:

Concept used: For monthly calls, orange color bars heights will be observed and for number of calls, green color bars heights will be observed with their related given values.
Calculation: By the graph, it is cleared that maximum height of green bar, showing monthly calls is 340, that is of age group 18-24, so age group 18-24 years placed the most monthly calls.
Conclusion: By given graph, it is concluded that age group 18-24 years, made the maximum number of monthly calls.
Chapter 4 Solutions
Pre-Algebra, Student Edition
Additional Math Textbook Solutions
A First Course in Probability (10th Edition)
Elementary Statistics: Picturing the World (7th Edition)
Using and Understanding Mathematics: A Quantitative Reasoning Approach (6th Edition)
A Problem Solving Approach To Mathematics For Elementary School Teachers (13th Edition)
University Calculus: Early Transcendentals (4th Edition)


- Consider the table of values below. x y 2 64 3 48 4 36 5 27 Fill in the right side of the equation y= with an expression that makes each ordered pari (x,y) in the table a solution to the equation.arrow_forwardsolving for xarrow_forwardConsider the table of values below. x y 2 63 3 70 4 77 5 84 Fill in the right side of the equation y= with an expression that makes each ordered pari (x,y) in the table a solution to the equation.arrow_forward
- There were 426 books sold in one week. The number of biology books sold was 5 times that of the number of psychology books. How many books each were sold?arrow_forwardPopulation decreases 5% each year. Starts with a starting population of 3705. Find that population after 5 years.arrow_forwardsolve using substitution -2x-3y=-15 -3x+9y=12arrow_forward
- Suppose that 7000 is placed in an accout that pays 4% interest. Interest compunds each year. Assume that no withdraws are made. How much would the account have after 1 year? And how much would the account have after 2 years?arrow_forwardUse substitution to solve the equations -2x+5y=18 x=2y-8arrow_forward5) For each function represented by an equation, make a table and plot the corresponding points to sketch the graph of the function. (a) y = 75 ()* 220 X y 200- -2 180 160 -1 140 0 120 100 1 60 80 2 3 4 x (b) y = 20 ()* 1 60 40 20 20 0 2 3 65- -1 X y 60 -2 55- 50 45 44 40 0 35- 30 1 25 2 20 20 15 3 10 5 LO 4 3-2 T -1 0 5- 4- -3- 2-arrow_forward
- A system of inequalities is shown. y 5 3 2 1 X -5 -4 -3 -2 -1 0 1 2 3 4 5 -1- Which system is represented in the graph? Oy>-x²-x+1 y 2x²+3 -2 -3 тarrow_forwardWhich set of systems of equations represents the solution to the graph? -5 -4 -3 -2 Of(x) = x² + 2x + 1 g(x) = x²+1 f(x) = x²+2x+1 g(x) = x²-1 f(x) = −x² + 2x + 1 g(x) = x²+1 f(x) = x² + 2x + 1 g(x) = x²-1 -1 5 y 4 3 2 1 0 -1- -2 -3- -4. -5 1 2 3 4 5arrow_forwardWhich of the graphs below correctly solves for x in the equation -x² - 3x-1=-x-4? о 10 8 (0,2) -10 -8 -6 -2 2 4 6 8 10 (-4,-2) -2 + (0,2) (4,6) -10-8-6-4-2 -2 2 4 6 8 10 (-3, -1) -2 2 (1-5) -6 -8 -10 10 -10-8-6-4-2 2 6 8 10 (2,0)arrow_forward
 Algebra and Trigonometry (6th Edition)AlgebraISBN:9780134463216Author:Robert F. BlitzerPublisher:PEARSON
 Contemporary Abstract AlgebraAlgebraISBN:9781305657960Author:Joseph GallianPublisher:Cengage Learning
 Linear Algebra: A Modern IntroductionAlgebraISBN:9781285463247Author:David PoolePublisher:Cengage Learning
 Algebra And Trigonometry (11th Edition)AlgebraISBN:9780135163078Author:Michael SullivanPublisher:PEARSON
 Introduction to Linear Algebra, Fifth EditionAlgebraISBN:9780980232776Author:Gilbert StrangPublisher:Wellesley-Cambridge Press
 College Algebra (Collegiate Math)AlgebraISBN:9780077836344Author:Julie Miller, Donna GerkenPublisher:McGraw-Hill Education