
Introduction to Statistics and Data Analysis
5th Edition
ISBN: 9781305750999
Author: Peck Olson Devore
Publisher: CENGAGE C
expand_more
expand_more
format_list_bulleted
Concept explainers
Videos
Textbook Question
Chapter 4.1, Problem 2E
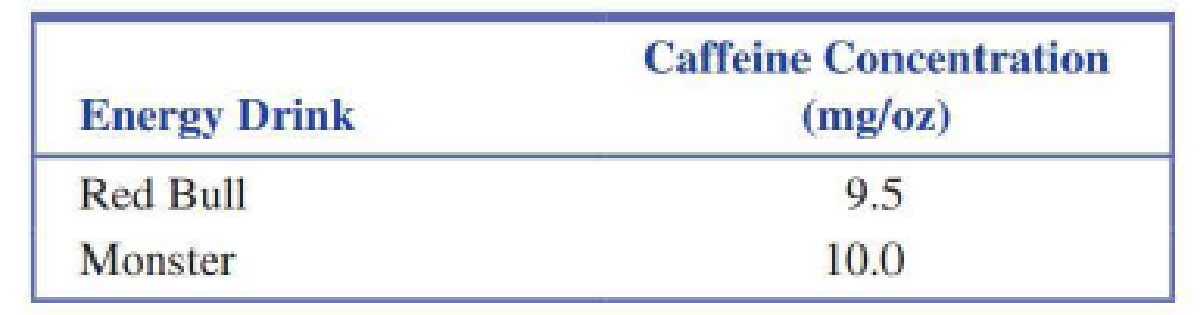
The article “Caffeine Content of Drinks” (caffeineinformer.com/the-caffeine-database, retrieved February 22, 2018) gave the following data on caffeine concentration (mg/ounce) for eight top-selling energy drinks:
- Data set available online
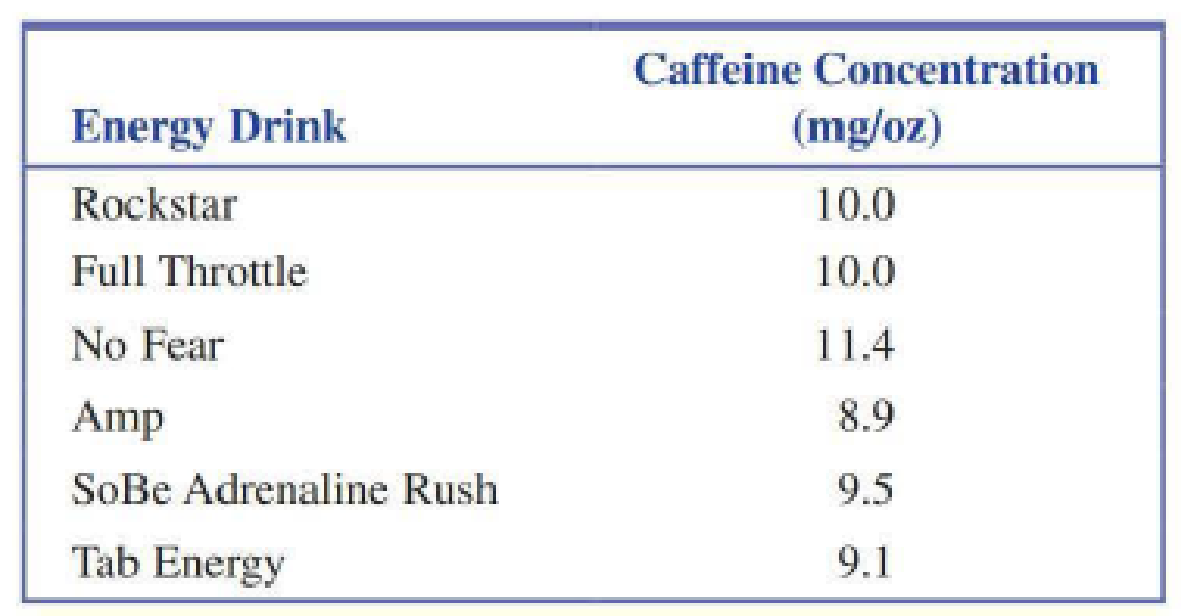
- a. What is the value of the
mean caffeine concentration for this set of top-selling energy drinks? - b. Coca-Cola has 2.9 mg/ounce of caffeine and Pepsi Cola has 3.2 mg/ounce of caffeine. Write a sentence explaining how the caffeine concentration of top-selling energy drinks compares to that of these colas.
Expert Solution & Answer

Trending nowThis is a popular solution!

Students have asked these similar questions
The following are suggested designs for group sequential studies. Using PROCSEQDESIGN, provide the following for the design O’Brien Fleming and Pocock.• The critical boundary values for each analysis of the data• The expected sample sizes at each interim analysisAssume the standardized Z score method for calculating boundaries.Investigators are evaluating the success rate of a novel drug for treating a certain type ofbacterial wound infection. Since no existing treatment exists, they have planned a one-armstudy. They wish to test whether the success rate of the drug is better than 50%, whichthey have defined as the null success rate. Preliminary testing has estimated the successrate of the drug at 55%. The investigators are eager to get the drug into production andwould like to plan for 9 interim analyses (10 analyzes in total) of the data. Assume thesignificance level is 5% and power is 90%.Besides, draw a combined boundary plot (OBF, POC, and HP)
Please provide the solution for the attached image in detailed.
20 km, because
GISS
Worksheet 10
Jesse runs a small business selling and delivering mealie meal to the spaza shops.
He charges a fixed rate of R80, 00 for delivery and then R15, 50 for each packet of
mealle meal he delivers. The table below helps him to calculate what to charge
his customers.
10
20
30
40
50
Packets of mealie
meal (m)
Total costs in Rands
80
235
390
545
700
855
(c)
10.1.
Define the following terms:
10.1.1. Independent Variables
10.1.2. Dependent Variables
10.2.
10.3.
10.4.
10.5.
Determine the independent and dependent variables.
Are the variables in this scenario discrete or continuous values? Explain
What shape do you expect the graph to be? Why?
Draw a graph on the graph provided to represent the information in the
table above.
TOTAL COST OF PACKETS OF MEALIE MEAL
900
800
700
600
COST (R)
500
400
300
200
100
0
10
20
30
40
60
NUMBER OF PACKETS OF MEALIE MEAL
Chapter 4 Solutions
Introduction to Statistics and Data Analysis
Ch. 4.1 - The Insurance Institute for Highway Safety...Ch. 4.1 - The article Caffeine Content of Drinks...Ch. 4.1 - Consumer Reports Health...Ch. 4.1 - Consumer Reports Health...Ch. 4.1 - Prob. 5ECh. 4.1 - Prob. 6ECh. 4.1 - Prob. 7ECh. 4.1 - Each student in a sample of 20 seniors at a...Ch. 4.1 - Prob. 9ECh. 4.1 - The ministry of Health and Long-Term Care in...
Ch. 4.1 - Houses in California are expensive, especially on...Ch. 4.1 - Consider the following statement: More than 65% of...Ch. 4.1 - A sample consisting of four pieces of luggage was...Ch. 4.1 - Suppose that 10 patients with meningitis received...Ch. 4.1 - A study of the lifetime (in hours) for a certain...Ch. 4.1 - An instructor has graded 19 exam papers submitted...Ch. 4.2 - The following data are costs (in cents) per ounce...Ch. 4.2 - Cost per serving (in cents) for six high-fiber...Ch. 4.2 - Combining the cost-per-serving data for high-fiber...Ch. 4.2 - Prob. 20ECh. 4.2 - The accompanying data are consistent with summary...Ch. 4.2 - The paper referenced in the previous exercise also...Ch. 4.2 - Prob. 23ECh. 4.2 - Prob. 24ECh. 4.2 - The accompanying data on number of minutes used...Ch. 4.2 - Give two sets of five numbers that have the same...Ch. 4.2 - Prob. 27ECh. 4.2 - The U.S. Department of Transportation reported the...Ch. 4.2 - The Ministry of Health and Long-Term Care in...Ch. 4.2 - In 1997, a woman sued a computer keyboard...Ch. 4.2 - The standard deviation alone does not measure...Ch. 4.3 - Based on a large national sample of working...Ch. 4.3 - Prob. 33ECh. 4.3 - Prob. 34ECh. 4.3 - Prob. 35ECh. 4.3 - Fiber content (in grams per serving) and sugar...Ch. 4.3 - Shown here are the number of auto accidents per...Ch. 4.4 - The average playing time of music albums in a...Ch. 4.4 - In a study investigating the effect of car speed...Ch. 4.4 - Prob. 40ECh. 4.4 - Mobile homes are tightly constructed for energy...Ch. 4.4 - Prob. 42ECh. 4.4 - A student took two national aptitude tests. The...Ch. 4.4 - Suppose that your younger sister is applying for...Ch. 4.4 - The report Who Borrows Most? Bachelors Degree...Ch. 4.4 - Prob. 46ECh. 4.4 - Prob. 47ECh. 4.4 - Suppose that your statistics professor returned...Ch. 4.4 - Prob. 49ECh. 4.4 - Suppose that the average reading speed of students...Ch. 4.4 - Prob. 51ECh. 4.4 - The accompanying table gives the mean and standard...Ch. 4.5 - The authors of the paper Delayed Time to...Ch. 4.5 - The paper Portable Social Groups: Willingness to...Ch. 4 - Prob. 55CRCh. 4 - Prob. 56CRCh. 4 - Prob. 57CRCh. 4 - Prob. 58CRCh. 4 - Because some homes have selling prices that are...Ch. 4 - Although bats are not known for their eyesight,...Ch. 4 - Prob. 61CRCh. 4 - Prob. 62CRCh. 4 - Prob. 63CRCh. 4 - Prob. 64CRCh. 4 - Prob. 65CRCh. 4 - Prob. 66CRCh. 4 - Prob. 67CRCh. 4 - Prob. 68CRCh. 4 - Prob. 69CRCh. 4 - Prob. 70CRCh. 4 - Prob. 71CRCh. 4 - Age at diagnosis for each of 20 patients under...Ch. 4 - Suppose that the distribution of scores on an exam...
Additional Math Textbook Solutions
Find more solutions based on key concepts
Reading, Writing, and Rounding Whole Numbers Write in words. 357
Mathematics for the Trades: A Guided Approach (11th Edition) (What's New in Trade Math)
Provide an example of a qualitative variable and an example of a quantitative variable.
Elementary Statistics ( 3rd International Edition ) Isbn:9781260092561
NOTE: Write your answers using interval notation when appropriate.
CHECKING ANALYTIC SKILLS Fill in each blank ...
Graphical Approach To College Algebra
Find E(X) for each of the distributions given in Exercise 2.1-3.
Probability And Statistical Inference (10th Edition)
(a) Make a stem-and-leaf plot for these 24 observations on the number of customers who used a down-town CitiBan...
APPLIED STAT.IN BUS.+ECONOMICS
Knowledge Booster


Learn more about
Need a deep-dive on the concept behind this application? Look no further. Learn more about this topic, statistics and related others by exploring similar questions and additional content below.Similar questions
- Let X be a random variable with support SX = {−3, 0.5, 3, −2.5, 3.5}. Part ofits probability mass function (PMF) is given bypX(−3) = 0.15, pX(−2.5) = 0.3, pX(3) = 0.2, pX(3.5) = 0.15.(a) Find pX(0.5).(b) Find the cumulative distribution function (CDF), FX(x), of X.1(c) Sketch the graph of FX(x).arrow_forwardA well-known company predominantly makes flat pack furniture for students. Variability with the automated machinery means the wood components are cut with a standard deviation in length of 0.45 mm. After they are cut the components are measured. If their length is more than 1.2 mm from the required length, the components are rejected. a) Calculate the percentage of components that get rejected. b) In a manufacturing run of 1000 units, how many are expected to be rejected? c) The company wishes to install more accurate equipment in order to reduce the rejection rate by one-half, using the same ±1.2mm rejection criterion. Calculate the maximum acceptable standard deviation of the new process.arrow_forward5. Let X and Y be independent random variables and let the superscripts denote symmetrization (recall Sect. 3.6). Show that (X + Y) X+ys.arrow_forward
- 8. Suppose that the moments of the random variable X are constant, that is, suppose that EX" =c for all n ≥ 1, for some constant c. Find the distribution of X.arrow_forward9. The concentration function of a random variable X is defined as Qx(h) = sup P(x ≤ X ≤x+h), h>0. Show that, if X and Y are independent random variables, then Qx+y (h) min{Qx(h). Qr (h)).arrow_forward10. Prove that, if (t)=1+0(12) as asf->> O is a characteristic function, then p = 1.arrow_forward
- 9. The concentration function of a random variable X is defined as Qx(h) sup P(x ≤x≤x+h), h>0. (b) Is it true that Qx(ah) =aQx (h)?arrow_forward3. Let X1, X2,..., X, be independent, Exp(1)-distributed random variables, and set V₁₁ = max Xk and W₁ = X₁+x+x+ Isk≤narrow_forward7. Consider the function (t)=(1+|t|)e, ER. (a) Prove that is a characteristic function. (b) Prove that the corresponding distribution is absolutely continuous. (c) Prove, departing from itself, that the distribution has finite mean and variance. (d) Prove, without computation, that the mean equals 0. (e) Compute the density.arrow_forward
- 1. Show, by using characteristic, or moment generating functions, that if fx(x) = ½ex, -∞0 < x < ∞, then XY₁ - Y2, where Y₁ and Y2 are independent, exponentially distributed random variables.arrow_forward1. Show, by using characteristic, or moment generating functions, that if 1 fx(x): x) = ½exarrow_forward1990) 02-02 50% mesob berceus +7 What's the probability of getting more than 1 head on 10 flips of a fair coin?arrow_forward
arrow_back_ios
SEE MORE QUESTIONS
arrow_forward_ios
Recommended textbooks for you
 Glencoe Algebra 1, Student Edition, 9780079039897...AlgebraISBN:9780079039897Author:CarterPublisher:McGraw Hill
 Big Ideas Math A Bridge To Success Algebra 1: Stu...AlgebraISBN:9781680331141Author:HOUGHTON MIFFLIN HARCOURTPublisher:Houghton Mifflin Harcourt
 Holt Mcdougal Larson Pre-algebra: Student Edition...AlgebraISBN:9780547587776Author:HOLT MCDOUGALPublisher:HOLT MCDOUGAL
 College Algebra (MindTap Course List)AlgebraISBN:9781305652231Author:R. David Gustafson, Jeff HughesPublisher:Cengage Learning
Glencoe Algebra 1, Student Edition, 9780079039897...
Algebra
ISBN:9780079039897
Author:Carter
Publisher:McGraw Hill
Big Ideas Math A Bridge To Success Algebra 1: Stu...
Algebra
ISBN:9781680331141
Author:HOUGHTON MIFFLIN HARCOURT
Publisher:Houghton Mifflin Harcourt
Holt Mcdougal Larson Pre-algebra: Student Edition...
Algebra
ISBN:9780547587776
Author:HOLT MCDOUGAL
Publisher:HOLT MCDOUGAL
College Algebra (MindTap Course List)
Algebra
ISBN:9781305652231
Author:R. David Gustafson, Jeff Hughes
Publisher:Cengage Learning
The Shape of Data: Distributions: Crash Course Statistics #7; Author: CrashCourse;https://www.youtube.com/watch?v=bPFNxD3Yg6U;License: Standard YouTube License, CC-BY
Shape, Center, and Spread - Module 20.2 (Part 1); Author: Mrmathblog;https://www.youtube.com/watch?v=COaid7O_Gag;License: Standard YouTube License, CC-BY
Shape, Center and Spread; Author: Emily Murdock;https://www.youtube.com/watch?v=_YyW0DSCzpM;License: Standard Youtube License