
Videos
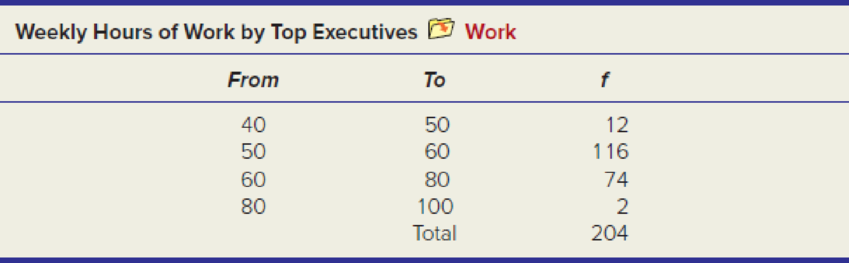
The self-reported number of hours worked per week by 204 top executives is given below. (a) Estimate the
a.
Estimate the mean, standard deviation and coefficient of variation from the grouped data and frequencies.
Answer to Problem 91CE
The mean, standard deviation and coefficient of variation from the grouped data and frequencies are:
| Measures | Values |
| Mean | 60.196 |
| Standard deviation | 8.536 |
| Coefficient of variation | 14.2% |
Explanation of Solution
Calculation:
The given information is about the distribution of number of hours worked per week by 204 top executives.
The mean for the grouped data is:
The standard deviation for the grouped data is:
Where,
n is the total sample size
If
Coefficient of variation:
The coefficient of variation (CV) is a measure of relative variability which is the ratio of the standard deviation to the mean. If the coefficient of variation is high, then level of dispersion around the mean is high. The CV is often expressed as a percentage.
Where, s be the sample standard deviation and
The table below gives the mean for the grouped data:
|
From |
To |
Frequency |
Mid-point | |||
| 40 | 50 | 12 | 540 | 2771.04 | ||
| 50 | 60 | 116 | 6,380 | 3131.768 | ||
| 60 | 80 | 74 | 5,180 | 7112.88 | ||
| 80 | 100 | 2 | 180 | 1776.56 | ||
The mean for the grouped data is:
Substitute the values
Thus, the mean from the grouped data and frequencies is 60.196.
The standard deviation for the grouped data is:
Substitute the values
Thus, the standard deviation from the grouped data and frequencies is 8.536.
The coefficient of variation is:
Substitute
Thus, the CV is 14.18%.
b.
State whether the unequal class size hamper the calculations.
Answer to Problem 91CE
No, the unequal class sizes hamper the calculations.
Explanation of Solution
The unequal sample sizes in the observations disturb the calculations. The unequal class sizes means that none of the class size will hold the value zero.
Want to see more full solutions like this?
Chapter 4 Solutions
Gen Combo Ll Applied Statistics In Business & Economics; Connect Access Card


- A company found that the daily sales revenue of its flagship product follows a normal distribution with a mean of $4500 and a standard deviation of $450. The company defines a "high-sales day" that is, any day with sales exceeding $4800. please provide a step by step on how to get the answers in excel Q: What percentage of days can the company expect to have "high-sales days" or sales greater than $4800? Q: What is the sales revenue threshold for the bottom 10% of days? (please note that 10% refers to the probability/area under bell curve towards the lower tail of bell curve) Provide answers in the yellow cellsarrow_forwardFind the critical value for a left-tailed test using the F distribution with a 0.025, degrees of freedom in the numerator=12, and degrees of freedom in the denominator = 50. A portion of the table of critical values of the F-distribution is provided. Click the icon to view the partial table of critical values of the F-distribution. What is the critical value? (Round to two decimal places as needed.)arrow_forwardA retail store manager claims that the average daily sales of the store are $1,500. You aim to test whether the actual average daily sales differ significantly from this claimed value. You can provide your answer by inserting a text box and the answer must include: Null hypothesis, Alternative hypothesis, Show answer (output table/summary table), and Conclusion based on the P value. Showing the calculation is a must. If calculation is missing,so please provide a step by step on the answers Numerical answers in the yellow cellsarrow_forward
 Glencoe Algebra 1, Student Edition, 9780079039897...AlgebraISBN:9780079039897Author:CarterPublisher:McGraw Hill
 Big Ideas Math A Bridge To Success Algebra 1: Stu...AlgebraISBN:9781680331141Author:HOUGHTON MIFFLIN HARCOURTPublisher:Houghton Mifflin Harcourt
 Holt Mcdougal Larson Pre-algebra: Student Edition...AlgebraISBN:9780547587776Author:HOLT MCDOUGALPublisher:HOLT MCDOUGAL