
Introductory Statistics (2nd Edition)
2nd Edition
ISBN: 9780321978271
Author: Robert Gould, Colleen N. Ryan
Publisher: PEARSON
expand_more
expand_more
format_list_bulleted
Concept explainers
Videos
Textbook Question
Chapter 4, Problem 81CRE
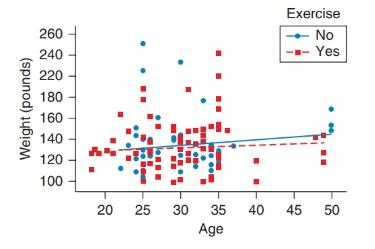
Age and Weight The following
Expert Solution & Answer
Want to see the full answer?
Check out a sample textbook solution
Students have asked these similar questions
Question 2: When John started his first job, his first end-of-year salary was $82,500. In the following years, he received salary raises as shown in the following table.
Fill the Table: Fill the following table showing his end-of-year salary for each year. I have already provided the end-of-year salaries for the first three years. Calculate the end-of-year salaries for the remaining years using Excel. (If you Excel answer for the top 3 cells is not the same as the one in the following table, your formula / approach is incorrect) (2 points)
Geometric Mean of Salary Raises: Calculate the geometric mean of the salary raises using the percentage figures provided in the second column named “% Raise”. (The geometric mean for this calculation should be nearly identical to the arithmetic mean. If your answer deviates significantly from the mean, it's likely incorrect. 2 points)
Hint for the first part of question 2: To assist you with filling out the table in the first part of the question,…
Consider a sample with data values of 27, 25, 20, 15, 30, 34, 28, and 25. Compute the range, interquartile range, variance, and standard deviation (to a maximum of 2 decimals, if decimals are necessary).
Range
Interquartile range
Variance
Standard deviation
Perform a Step by step following tests in Microsoft Excel. Each of the following is 0.5 points, with a total of 6 points. Provide your answers in the following table.
Median
Standard Deviation
Minimum
Maximum
Range
1st Quartile
2nd Quartile
3rd Quartile
Skewness; provide a one sentence explanation of what does the skewness value indicates
Kurtosis; provide a one sentence explanation of what does the kurtosis value indicates
Make a labelled histogram; no point awarded if it is not labelled
Make a labelled boxplot; no point awarded if it is not labelled
Data
27
30
22
25
24
22
20
28
20
26
21
23
24
20
28
30
20
28
29
30
21
26
29
25
26
25
20
30
26
28
25
21
22
27
27
24
26
22
29
28
30
22
22
22
30
21
21
30
26
20
Chapter 4 Solutions
Introductory Statistics (2nd Edition)
Ch. 4 - Predicting Land Value Both scatterplots concern...Ch. 4 - Predicting Total Value of Property Both...Ch. 4 - Car Value and Age of Student The scatterplot shows...Ch. 4 - Shoe Size and GPA The figure shows a scatterplot...Ch. 4 - Weight Loss (Example 1) The scatterplot shows the...Ch. 4 - Comparing Salaries The scatterplot shows the...Ch. 4 - Sisters and Brothers The scatterplot shows the...Ch. 4 - BAs and Median Income The scatterplot shows data...Ch. 4 - Work and TV The scatterplot shows the number of...Ch. 4 - Work and Sleep The scatterplot shows the number of...
Ch. 4 - Age and Sleep The scatterplot shows the age and...Ch. 4 - Height and Weight for Women The figure shows a...Ch. 4 - College Tuition and ACT a. The first scatterplot...Ch. 4 - Ages of Women Who Give Birth The figure shows a...Ch. 4 - Do Older Students Have Higher GPAs? On the basis...Ch. 4 - Handspans Refer to the figure. a. Would it make...Ch. 4 - Matching Pick the letter of the graph that goes...Ch. 4 - Matching Pick the letter of the graph that goes...Ch. 4 - Matching Match each of the following correlations...Ch. 4 - Matching Match each of the following correlations...Ch. 4 - Trash (Example 2) The table shows the number of...Ch. 4 - Cost of Flights The table for part a shows...Ch. 4 - Work Hour and TV Hours In Exercise 4.9 there was a...Ch. 4 - House Price The correlation between house price...Ch. 4 - Rate My Professor Seth Wagerman, a former...Ch. 4 - Cousins Five people were asked how many female...Ch. 4 - + Video Games and BMI The table gives some...Ch. 4 - See-Saw The table gives data on the heights (above...Ch. 4 - Salaries of College Graduates (Example 3) The...Ch. 4 - Mother and Daughter Heights The graph shows the...Ch. 4 - Are Men Paid More Than Women? The scatterplot...Ch. 4 - Home Prices and Areas of Four Bedroom Homes a....Ch. 4 - Height and Arm Span for Women (Example 4) TI-84...Ch. 4 - Hand and Foot Length for Women The computer output...Ch. 4 - Height and Arm Span for Men (Example 5)...Ch. 4 - Hand Length and Foot Length for Men Measurements...Ch. 4 - Comparing Correlation for Arm Span and Height The...Ch. 4 - Age and Weight for Men and Women The scatterplot...Ch. 4 - Social Security Number and Age The figure shows a...Ch. 4 - Seesaw The figure shows a scatterplot of the...Ch. 4 - Choosing the Predictor and Response (Example 6)...Ch. 4 - Choosing the Predictor and Response Indicate which...Ch. 4 - Percentage of Smoke-Free Homes and Percentage of...Ch. 4 - Effect of Adult Smoking on High School Student...Ch. 4 - Driver’s Deaths and Ages The figure shows a graph...Ch. 4 - Do Women Tend to Live Longer Than Men? The figure...Ch. 4 - How Is the Time of a Flight Related to the...Ch. 4 - English in California Schools This problem...Ch. 4 - Do States with Higher Populations Have More...Ch. 4 - Semesters and Units The table shows the...Ch. 4 - Pitchers The table shows the number of wins and...Ch. 4 - Text Messages The following table shows the number...Ch. 4 - Answer the question using complete sentence. a....Ch. 4 - Answer the question, using complete sentences. a....Ch. 4 - If there is a positive correlation between number...Ch. 4 - Suppose that the growth rate of children looks...Ch. 4 - Coefficient of Determination If the correlation...Ch. 4 - Coefficient of Determination Does a correlation of...Ch. 4 - Investing Some investors use a technique called...Ch. 4 - Blood Pressure Suppose a doctor telephones those...Ch. 4 - Salary and Year of Employment (Example 8) The...Ch. 4 - MPG: Highway and City The following figure shows...Ch. 4 - Cost of Turkeys The table shows the weights and...Ch. 4 - Iraq Casualties and Population of Hometowns The...Ch. 4 - Teachers’ Pay and Costs of Education (Example 9)...Ch. 4 - Teachers’ Pay the figure shows a scatterplot with...Ch. 4 - Does Having a Job Affect Students’ Grades?...Ch. 4 - Weight of Trash and Household Size Data were...Ch. 4 - Age and Text Messages The scatterplot shows the...Ch. 4 - Life Expectancy and TVs The scatterplot shows the...Ch. 4 - Education of Fathers and Mothers The data shown in...Ch. 4 - Heights of Fathers and Sons The table shows some...Ch. 4 - Test Scores Assume that in a political science...Ch. 4 - Test Scores Assume that in a sociology class, the...Ch. 4 - Heights and Weights of People The following table...Ch. 4 - Heights and Weights of Men The table shows the...Ch. 4 - Homes The table shows the asking price (in...Ch. 4 - Alcohol and Calories in Beer At the text’s website...Ch. 4 - Shoe Size and Height The scatterplot shows the...Ch. 4 - Age and Sleep The following scatterplot shows the...Ch. 4 - Age and Weight The following scatterplot shows the...Ch. 4 - Heights and Test Scores a. The following figure...Ch. 4 - Prob. 83CRECh. 4 - Age and Happiness Happiness ratings were from I...Ch. 4 - Tree Heights Loggers gathered information about...Ch. 4 - Film Budgets and Grosses Movie studios exert much...Ch. 4 - Gas Mileage of Cars The table gives the number of...Ch. 4 - Tall Buildings The following scatterplot shows...Ch. 4 - Bar-Passing Rate To become a lawyer, you must pass...Ch. 4 - For 4.91 through 4.94 show your points in a rough...Ch. 4 - For 4.91 through 4.94 show your points in a rough...Ch. 4 - For 4.91 through 4.94 show your points in a rough...Ch. 4 - For 4.91 through 4.94 show your points in a rough...Ch. 4 - The following figure shows a scatterplot of the...Ch. 4 - Wages and Education The figure shows a scatterplot...Ch. 4 - Do Students Taking More Units Study More Hours?...Ch. 4 - Hours of Exercise and Hours of Homework The...Ch. 4 - Children’s Ages and Heights The following figure...Ch. 4 - Blackjack Tips The following figure shows the...Ch. 4 - Decrease in Cholesterol A doctor is studying...Ch. 4 - Prob. 102CRE
Additional Math Textbook Solutions
Find more solutions based on key concepts
For Exercises 13–18, write the negation of the statement.
13. The cell phone is out of juice.
Math in Our World
For Problems 23-28, write in simpler form, as in Example 4. logbFG
Finite Mathematics for Business, Economics, Life Sciences and Social Sciences
1. How is a sample related to a population?
Elementary Statistics: Picturing the World (7th Edition)
Check Your Understanding
Reading Check Complete each sentence using > or < for □.
RC1. 3 dm □ 3 dam
Basic College Mathematics
147. Draining a tank Water drains from the conical tank shown in the accompanying figure at the rate .
a. What...
University Calculus
(a) Make a stem-and-leaf plot for these 24 observations on the number of customers who used a down-town CitiBan...
APPLIED STAT.IN BUS.+ECONOMICS
Knowledge Booster


Learn more about
Need a deep-dive on the concept behind this application? Look no further. Learn more about this topic, statistics and related others by exploring similar questions and additional content below.Similar questions
- Obtain the linear equation for trend for time series with St² = 140, Ey = 16.91 and Σty= 62.02, m n = 7arrow_forwardA quality characteristic of a product is normally distributed with mean μ and standard deviation σ = 1. Speci- fications on the characteristic are 6≤x≤8. A unit that falls within specifications on this quality characteristic results in a profit of Co. However, if x 8, the profit is -C2. Find the value ofμ that maximizes the expected profit.arrow_forwardA) The output voltage of a power supply is normally distributed with mean 5 V and standard deviation 0.02 V. If the lower and upper specifications for voltage are 4.95 V and 5.05 V, respectively, what is the probability that a power supply selected at random conform to the specifications on voltage? B) Continuation of A. Reconsider the power supply manufacturing process in A. Suppose We wanted to improve the process. Can shifting the mean reduce the number of nonconforming units produced? How much would the process variability need to be reduced in order to have all but one out of 1000 units conform to the specifications?arrow_forward
- der to complete the Case X T Civil Service Numerical Test Sec X T Casework Skills Practice Test Maseline Vaseline x + euauthoring.panpowered.com/DeliveryWeb/Civil Service Main/84589a48-6934-4b6e-a6e1-a5d75f559df9?transferToken-News NGSSON The table below shows the best price available for various items from 4 uniform suppliers. The prices do not include VAT (charged at 20%). Item Waterproof boots A1-Uniforms (£)Best Trade (£)Clothing Tech (£)Dress Right (£) 59.99 39.99 59.99 49.99 Trousers 9.89 9.98 9.99 11.99 Shirts 14.99 15.99 16.99 12.99 Hi-Vis vest 4.49 4.50 4.00 4.00 20.00 25.00 19.50 19.99 Hard hats A company needs to buy a set of 12 uniforms which includes 1 of each item. If the special offers are included which supplier is cheapest? OOO A1-Uniforms Best Trade Clothing Tech Q Search + ** 109 8 CO* F10 Home F11 F12 6arrow_forwardto complete the Case × T Civil Service Numerical Test Sec x T Casework Skills Practice Test + Vaseline euauthoring.panpowered.com/DeliveryWeb/Civil Service Main/84589a48-b934-4b6e-a6e1-a5d75f559df9?transferToken=MxNewOS NGFSPSZSMOMzuz The table below shows the best price available for various items from 4 uniform suppliers. The prices do not include VAT (charged at 20%). Item A1-Uniforms (£)Best Trade (£)Clothing Tech (£)Dress Right (£) Waterproof boots 59.99 39.99 59.99 49.99 Trousers 9.89 9.98 9.99 11.99 Shirts 14.99 15.99 16.99 12.99 Hi-Vis vest 4.49 4.50 4.00 4.00 20.00 25.00 19.50 19.99 Hard hats A company needs to buy a set of 12 uniforms which includes 1 of each item. If the special offers are included, which supplier is cheapest? O O O O A1-Uniforms Best Trade Clothing Tech Dress Right Q Search ENG L UK +0 F6 四吧 6 78 ㄓ F10 9% * CO 1 F12 34 Oarrow_forwardCritics review films out of 5 based on three attributes: the story, the special effects and the acting. The ratings of four critics for a film are collected in the table below.CriticSpecialStory rating Effects rating Acting rating Critic 14.44.34.5Critic 24.14.23.9Critic 33.943.4Critic 44.24.14.2Critic 1 also gave the film a rating for the Director's ability. If the average of Critic 1's ratings was 4.3 what rating did they give to the Director's ability?3.94.04.14.24.3arrow_forward
- Two measurements are made of some quantity. For the first measurement, the average is 74.4528, the RMS error is 6.7441, and the uncertainty of the mean is 0.9264. For the second one, the average is 76.8415, the standard deviation is 8.3348, and the uncertainty of the mean is 1.1448. The expected value is exactly 75. 13. Express the first measurement in public notation. 14. Is there a significant difference between the two measurements? 1 15. How does the first measurement compare with the expected value? 16. How does the second measurement compare with the expected value?arrow_forwardA hat contains slips of paper numbered 1 through 6. You draw two slips of paper at random from the hat,without replacing the first slip into the hat.(a) (5 points) Write out the sample space S for this experiment.(b) (5 points) Express the event E : {the sum of the numbers on the slips of paper is 4} as a subset of S.(c) (5 points) Find P(E)(d) (5 points) Let F = {the larger minus the smaller number is 0}. What is P(F )?(e) (5 points) Are E and F disjoint? Why or why not?(f) (5 points) Find P(E ∪ F )arrow_forwardIn addition to the in-school milk supplement program, the nurse would like to increase the use of daily vitamin supplements for the children by visiting homes and educating about the merits of vitamins. She believes that currently, about 50% of families with school-age children give the children a daily megavitamin. She would like to increase this to 70%. She plans a two-group study, where one group serves as a control and the other group receives her visits. How many families should she expect to visit to have 80% power of detecting this difference? Assume that drop-out rate is 5%.arrow_forward
- A recent survey of 400 americans asked whether or not parents do too much for their young adult children. The results of the survey are shown in the data file. a) Construct the frequency and relative frequency distributions. How many respondents felt that parents do too much for their adult children? What proportion of respondents felt that parents do too little for their adult children? b) Construct a pie chart. Summarize the findingsarrow_forwardThe average number of minutes Americans commute to work is 27.7 minutes (Sterling's Best Places, April 13, 2012). The average commute time in minutes for 48 cities are as follows: Click on the datafile logo to reference the data. DATA file Albuquerque 23.3 Jacksonville 26.2 Phoenix 28.3 Atlanta 28.3 Kansas City 23.4 Pittsburgh 25.0 Austin 24.6 Las Vegas 28.4 Portland 26.4 Baltimore 32.1 Little Rock 20.1 Providence 23.6 Boston 31.7 Los Angeles 32.2 Richmond 23.4 Charlotte 25.8 Louisville 21.4 Sacramento 25.8 Chicago 38.1 Memphis 23.8 Salt Lake City 20.2 Cincinnati 24.9 Miami 30.7 San Antonio 26.1 Cleveland 26.8 Milwaukee 24.8 San Diego 24.8 Columbus 23.4 Minneapolis 23.6 San Francisco 32.6 Dallas 28.5 Nashville 25.3 San Jose 28.5 Denver 28.1 New Orleans 31.7 Seattle 27.3 Detroit 29.3 New York 43.8 St. Louis 26.8 El Paso 24.4 Oklahoma City 22.0 Tucson 24.0 Fresno 23.0 Orlando 27.1 Tulsa 20.1 Indianapolis 24.8 Philadelphia 34.2 Washington, D.C. 32.8 a. What is the mean commute time for…arrow_forwardMorningstar tracks the total return for a large number of mutual funds. The following table shows the total return and the number of funds for four categories of mutual funds. Click on the datafile logo to reference the data. DATA file Type of Fund Domestic Equity Number of Funds Total Return (%) 9191 4.65 International Equity 2621 18.15 Hybrid 1419 2900 11.36 6.75 Specialty Stock a. Using the number of funds as weights, compute the weighted average total return for these mutual funds. (to 2 decimals) % b. Is there any difficulty associated with using the "number of funds" as the weights in computing the weighted average total return in part (a)? Discuss. What else might be used for weights? The input in the box below will not be graded, but may be reviewed and considered by your instructor. c. Suppose you invested $10,000 in this group of mutual funds and diversified the investment by placing $2000 in Domestic Equity funds, $4000 in International Equity funds, $3000 in Specialty Stock…arrow_forward
arrow_back_ios
SEE MORE QUESTIONS
arrow_forward_ios
Recommended textbooks for you
 MATLAB: An Introduction with ApplicationsStatisticsISBN:9781119256830Author:Amos GilatPublisher:John Wiley & Sons Inc
 Probability and Statistics for Engineering and th...StatisticsISBN:9781305251809Author:Jay L. DevorePublisher:Cengage Learning
 Statistics for The Behavioral Sciences (MindTap C...StatisticsISBN:9781305504912Author:Frederick J Gravetter, Larry B. WallnauPublisher:Cengage Learning
 Elementary Statistics: Picturing the World (7th E...StatisticsISBN:9780134683416Author:Ron Larson, Betsy FarberPublisher:PEARSON
 The Basic Practice of StatisticsStatisticsISBN:9781319042578Author:David S. Moore, William I. Notz, Michael A. FlignerPublisher:W. H. Freeman
 Introduction to the Practice of StatisticsStatisticsISBN:9781319013387Author:David S. Moore, George P. McCabe, Bruce A. CraigPublisher:W. H. Freeman
MATLAB: An Introduction with Applications
Statistics
ISBN:9781119256830
Author:Amos Gilat
Publisher:John Wiley & Sons Inc
Probability and Statistics for Engineering and th...
Statistics
ISBN:9781305251809
Author:Jay L. Devore
Publisher:Cengage Learning
Statistics for The Behavioral Sciences (MindTap C...
Statistics
ISBN:9781305504912
Author:Frederick J Gravetter, Larry B. Wallnau
Publisher:Cengage Learning
Elementary Statistics: Picturing the World (7th E...
Statistics
ISBN:9780134683416
Author:Ron Larson, Betsy Farber
Publisher:PEARSON
The Basic Practice of Statistics
Statistics
ISBN:9781319042578
Author:David S. Moore, William I. Notz, Michael A. Fligner
Publisher:W. H. Freeman
Introduction to the Practice of Statistics
Statistics
ISBN:9781319013387
Author:David S. Moore, George P. McCabe, Bruce A. Craig
Publisher:W. H. Freeman
Statistics 4.1 Introduction to Inferential Statistics; Author: Dr. Jack L. Jackson II;https://www.youtube.com/watch?v=QLo4TEvBvK4;License: Standard YouTube License, CC-BY