
Introductory Statistics (2nd Edition)
2nd Edition
ISBN: 9780321978271
Author: Robert Gould, Colleen N. Ryan
Publisher: PEARSON
expand_more
expand_more
format_list_bulleted
Videos
Textbook Question
Chapter 4, Problem 4SE
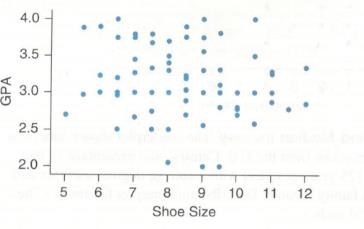
Shoe Size and GPA The figure shows a
Expert Solution & Answer
Want to see the full answer?
Check out a sample textbook solution
Students have asked these similar questions
21
Check out the sales of a particular car across
the United States over a 60-day period in the
following figure.
800-
700-
600-
Number of items sold
400
500-
Line Graph of Sales
3001
16 12 18 24 30 36 42 48 54
60
60
Day
a. Can you see a pattern to the sales of this
car across this time period?
b. What are the highest and lowest numbers
of sales, and when did they occur?
c. Can
Can you estimate the average of all sales
over this time period?
11
Bob has glued himself to a certain slot
machine for four hours in a row now with
his bucket of coins and a bad attitude. He
doesn't want to leave because he feels the
longer he plays, the better chance he has t
win eventually. Is poor Bob right?
7
You feel lucky again and buy a handful of
instant lottery tickets. The last three tickets
you open each win a dollar. Should you buy
another ticket because you're "on a roll"?
Chapter 4 Solutions
Introductory Statistics (2nd Edition)
Ch. 4 - Predicting Land Value Both scatterplots concern...Ch. 4 - Predicting Total Value of Property Both...Ch. 4 - Car Value and Age of Student The scatterplot shows...Ch. 4 - Shoe Size and GPA The figure shows a scatterplot...Ch. 4 - Weight Loss (Example 1) The scatterplot shows the...Ch. 4 - Comparing Salaries The scatterplot shows the...Ch. 4 - Sisters and Brothers The scatterplot shows the...Ch. 4 - BAs and Median Income The scatterplot shows data...Ch. 4 - Work and TV The scatterplot shows the number of...Ch. 4 - Work and Sleep The scatterplot shows the number of...
Ch. 4 - Age and Sleep The scatterplot shows the age and...Ch. 4 - Height and Weight for Women The figure shows a...Ch. 4 - College Tuition and ACT a. The first scatterplot...Ch. 4 - Ages of Women Who Give Birth The figure shows a...Ch. 4 - Do Older Students Have Higher GPAs? On the basis...Ch. 4 - Handspans Refer to the figure. a. Would it make...Ch. 4 - Matching Pick the letter of the graph that goes...Ch. 4 - Matching Pick the letter of the graph that goes...Ch. 4 - Matching Match each of the following correlations...Ch. 4 - Matching Match each of the following correlations...Ch. 4 - Trash (Example 2) The table shows the number of...Ch. 4 - Cost of Flights The table for part a shows...Ch. 4 - Work Hour and TV Hours In Exercise 4.9 there was a...Ch. 4 - House Price The correlation between house price...Ch. 4 - Rate My Professor Seth Wagerman, a former...Ch. 4 - Cousins Five people were asked how many female...Ch. 4 - + Video Games and BMI The table gives some...Ch. 4 - See-Saw The table gives data on the heights (above...Ch. 4 - Salaries of College Graduates (Example 3) The...Ch. 4 - Mother and Daughter Heights The graph shows the...Ch. 4 - Are Men Paid More Than Women? The scatterplot...Ch. 4 - Home Prices and Areas of Four Bedroom Homes a....Ch. 4 - Height and Arm Span for Women (Example 4) TI-84...Ch. 4 - Hand and Foot Length for Women The computer output...Ch. 4 - Height and Arm Span for Men (Example 5)...Ch. 4 - Hand Length and Foot Length for Men Measurements...Ch. 4 - Comparing Correlation for Arm Span and Height The...Ch. 4 - Age and Weight for Men and Women The scatterplot...Ch. 4 - Social Security Number and Age The figure shows a...Ch. 4 - Seesaw The figure shows a scatterplot of the...Ch. 4 - Choosing the Predictor and Response (Example 6)...Ch. 4 - Choosing the Predictor and Response Indicate which...Ch. 4 - Percentage of Smoke-Free Homes and Percentage of...Ch. 4 - Effect of Adult Smoking on High School Student...Ch. 4 - Driver’s Deaths and Ages The figure shows a graph...Ch. 4 - Do Women Tend to Live Longer Than Men? The figure...Ch. 4 - How Is the Time of a Flight Related to the...Ch. 4 - English in California Schools This problem...Ch. 4 - Do States with Higher Populations Have More...Ch. 4 - Semesters and Units The table shows the...Ch. 4 - Pitchers The table shows the number of wins and...Ch. 4 - Text Messages The following table shows the number...Ch. 4 - Answer the question using complete sentence. a....Ch. 4 - Answer the question, using complete sentences. a....Ch. 4 - If there is a positive correlation between number...Ch. 4 - Suppose that the growth rate of children looks...Ch. 4 - Coefficient of Determination If the correlation...Ch. 4 - Coefficient of Determination Does a correlation of...Ch. 4 - Investing Some investors use a technique called...Ch. 4 - Blood Pressure Suppose a doctor telephones those...Ch. 4 - Salary and Year of Employment (Example 8) The...Ch. 4 - MPG: Highway and City The following figure shows...Ch. 4 - Cost of Turkeys The table shows the weights and...Ch. 4 - Iraq Casualties and Population of Hometowns The...Ch. 4 - Teachers’ Pay and Costs of Education (Example 9)...Ch. 4 - Teachers’ Pay the figure shows a scatterplot with...Ch. 4 - Does Having a Job Affect Students’ Grades?...Ch. 4 - Weight of Trash and Household Size Data were...Ch. 4 - Age and Text Messages The scatterplot shows the...Ch. 4 - Life Expectancy and TVs The scatterplot shows the...Ch. 4 - Education of Fathers and Mothers The data shown in...Ch. 4 - Heights of Fathers and Sons The table shows some...Ch. 4 - Test Scores Assume that in a political science...Ch. 4 - Test Scores Assume that in a sociology class, the...Ch. 4 - Heights and Weights of People The following table...Ch. 4 - Heights and Weights of Men The table shows the...Ch. 4 - Homes The table shows the asking price (in...Ch. 4 - Alcohol and Calories in Beer At the text’s website...Ch. 4 - Shoe Size and Height The scatterplot shows the...Ch. 4 - Age and Sleep The following scatterplot shows the...Ch. 4 - Age and Weight The following scatterplot shows the...Ch. 4 - Heights and Test Scores a. The following figure...Ch. 4 - Prob. 83CRECh. 4 - Age and Happiness Happiness ratings were from I...Ch. 4 - Tree Heights Loggers gathered information about...Ch. 4 - Film Budgets and Grosses Movie studios exert much...Ch. 4 - Gas Mileage of Cars The table gives the number of...Ch. 4 - Tall Buildings The following scatterplot shows...Ch. 4 - Bar-Passing Rate To become a lawyer, you must pass...Ch. 4 - For 4.91 through 4.94 show your points in a rough...Ch. 4 - For 4.91 through 4.94 show your points in a rough...Ch. 4 - For 4.91 through 4.94 show your points in a rough...Ch. 4 - For 4.91 through 4.94 show your points in a rough...Ch. 4 - The following figure shows a scatterplot of the...Ch. 4 - Wages and Education The figure shows a scatterplot...Ch. 4 - Do Students Taking More Units Study More Hours?...Ch. 4 - Hours of Exercise and Hours of Homework The...Ch. 4 - Children’s Ages and Heights The following figure...Ch. 4 - Blackjack Tips The following figure shows the...Ch. 4 - Decrease in Cholesterol A doctor is studying...Ch. 4 - Prob. 102CRE
Knowledge Booster


Learn more about
Need a deep-dive on the concept behind this application? Look no further. Learn more about this topic, statistics and related others by exploring similar questions and additional content below.Similar questions
- 5 Suppose that an NBA player's free throw shooting percentage is 70 percent. a. Explain what this means as a probability. b. What's wrong with thinking that his chances of making his next free throw are 50-50 (because he either makes it or he doesn't)? 78 PART 2 Probability.arrow_forwardA couple has conceived three girls so far with a fourth baby on the way. Do you predict the newborn will be a girl or a boy? Why?arrow_forward2 Suppose that you flip a coin four times, and it comes up heads each time. Does this outcome give you reason to believe that the coin isn't legitimate? dedo Raupnu stens My be sunildes ad ndaniver uoy no grin PALO STO 2010 COMO IT COUarrow_forward
- 3 Consider tossing a fair coin 10 times and recording the number of heads that occur. a. How many possible outcomes would occur? b. What would be the probability of each of the outcomes? c. How many of the outcomes would have 1 head? What is the probability of 1 head in 10 flips? how d. How many of the outcomes would have o heads? What is the probability of o heads in 10 flips? e. What's the probability of getting 1 head or less on 10 flips of a fair coin?arrow_forward22 Bob decides that after his heart attack is a good time to get in shape, so he starts exer- cising each day and plans to increase his exercise time as he goes along. Look at the two line graphs shown in the following fig- ures. One is a good representation of his data, and the other should get as much use as Bob's treadmill before his heart attack. Exercise time 40 Line Graph 1 of Exercise Log 35 30- 25 201 20 Exercise time 80 80 60 40- 1 10 20 30 30 40 50 60 Day 170 50 80 Line Graph 2 of Exercise Log 1 10 20 90 100 30 30 40 50 60 70 80 90 100 Day a. Compare the two graphs. Do they repre- sent the same data set, or do they show totally different data sets? b. Assume that both graphs are made from the same data. Which graph is more appropriate and why?arrow_forward8 Suppose that a small town has five people with a rare form of cancer. Does this auto- matically mean a huge problem exists that needs to be addressed?arrow_forward
- 1 M&Ms colors come in the following percent- ages: 13 percent brown, 14 percent yellow, 13 percent red, 24 percent blue, 20 percent orange, and 16 percent green. Reach into a bag of M&Ms without looking. a. What's the chance that you pull out a brown or yellow M&M? b. What's the chance that you won't pull out a blue? swarrow_forward11. Prove or disprove: (a) If is a characteristic function, then so is ²; (b) If is a non-negative characteristic function, then so is √√4.arrow_forward4. Suppose that P(X = 1) = P(X = -1) = 1/2, that Y = U(-1, 1) and that X and Y are independent. (a) Show, by direct computation, that X + Y = U(-2, 2). (b) Translate the result to a statement about characteristic functions. (c) Which well-known trigonometric formula did you discover?arrow_forward
- 9. The concentration function of a random variable X is defined as Qx(h) = sup P(x ≤ X ≤x+h), h>0. x (a) Show that Qx+b (h) = Qx(h). (b) Is it true that Qx(ah) =aQx(h)? (c) Show that, if X and Y are independent random variables, then Qx+y (h) min{Qx(h). Qy (h)). To put the concept in perspective, if X1, X2, X, are independent, identically distributed random variables, and S₁ = Z=1Xk, then there exists an absolute constant, A, such that A Qs, (h) ≤ √n Some references: [79, 80, 162, 222], and [204], Sect. 1.5.arrow_forward29 Suppose that a mound-shaped data set has a must mean of 10 and standard deviation of 2. a. About what percentage of the data should lie between 6 and 12? b. About what percentage of the data should lie between 4 and 6? c. About what percentage of the data should lie below 4? 91002 175/1 3arrow_forward2,3, ample and rical t? the 28 Suppose that a mound-shaped data set has a mean of 10 and standard deviation of 2. a. About what percentage of the data should lie between 8 and 12? b. About what percentage of the data should lie above 10? c. About what percentage of the data should lie above 12?arrow_forward
arrow_back_ios
SEE MORE QUESTIONS
arrow_forward_ios
Recommended textbooks for you
 Glencoe Algebra 1, Student Edition, 9780079039897...AlgebraISBN:9780079039897Author:CarterPublisher:McGraw Hill
 Holt Mcdougal Larson Pre-algebra: Student Edition...AlgebraISBN:9780547587776Author:HOLT MCDOUGALPublisher:HOLT MCDOUGAL
 Big Ideas Math A Bridge To Success Algebra 1: Stu...AlgebraISBN:9781680331141Author:HOUGHTON MIFFLIN HARCOURTPublisher:Houghton Mifflin Harcourt
 Algebra and Trigonometry (MindTap Course List)AlgebraISBN:9781305071742Author:James Stewart, Lothar Redlin, Saleem WatsonPublisher:Cengage Learning
 Elementary AlgebraAlgebraISBN:9780998625713Author:Lynn Marecek, MaryAnne Anthony-SmithPublisher:OpenStax - Rice University
Glencoe Algebra 1, Student Edition, 9780079039897...
Algebra
ISBN:9780079039897
Author:Carter
Publisher:McGraw Hill
Holt Mcdougal Larson Pre-algebra: Student Edition...
Algebra
ISBN:9780547587776
Author:HOLT MCDOUGAL
Publisher:HOLT MCDOUGAL
Big Ideas Math A Bridge To Success Algebra 1: Stu...
Algebra
ISBN:9781680331141
Author:HOUGHTON MIFFLIN HARCOURT
Publisher:Houghton Mifflin Harcourt
Algebra and Trigonometry (MindTap Course List)
Algebra
ISBN:9781305071742
Author:James Stewart, Lothar Redlin, Saleem Watson
Publisher:Cengage Learning
Elementary Algebra
Algebra
ISBN:9780998625713
Author:Lynn Marecek, MaryAnne Anthony-Smith
Publisher:OpenStax - Rice University
Time Series Analysis Theory & Uni-variate Forecasting Techniques; Author: Analytics University;https://www.youtube.com/watch?v=_X5q9FYLGxM;License: Standard YouTube License, CC-BY
Operations management 101: Time-series, forecasting introduction; Author: Brandoz Foltz;https://www.youtube.com/watch?v=EaqZP36ool8;License: Standard YouTube License, CC-BY