
Concept explainers
Videos
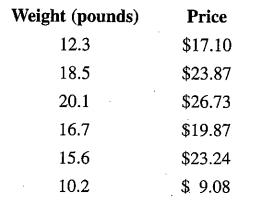
Cost of Turkeys The table shows the weights and prices of some turkeys at different supermarkets.
a. Make a
b. Find the numerical value for the
c. Report the equation of the best-fit straight line, using weight as the predictor
d. Report the slope and intercept of the regression line, and explain what they show. If the intercept is not appropriate to report, explain why.
e. Add a new point to your data: a 30-pound turkey that is free. Give the new value for
Want to see the full answer?
Check out a sample textbook solution
Chapter 4 Solutions
Ten Lessons in Introductory Sociology


- A data processing company has a training program for new salespeople. After completing the training program, each trainee is ranked by his or her instructor. After a year of sales, the same class of trainees is again ranked by a company supervisor according to net value of the contracts they have acquired for the company. The results for a random sample of 11 salespeople trained in the last year follow, where x is rank in training class and y is rank in sales after 1 year. Lower ranks mean higher standing in class and higher net sales. Person 1 2 3 4 5 6 x rank 8 11 2 4 5 3 y rank 7 10 1 3 2 4 Person 7 8 9 10 11 x rank 7 9 10 1 6 y rank 8 11 9 6 5 Using a 1% level of significance, test the claim that the relation between x and y is monotone (either increasing or decreasing). Verify that the Spearman rank correlation coefficient . This implies that the P-value lies between 0.002 and 0.01. State…arrow_forwardSand and clay studies were conducted at a site in California. Twelve consecutive depths, each about 15 cm deep, were studied and the following percentages of sand in the soil were recorded. 34.4 27.1 30.8 28.0 32.2 27.6 32.8 25.2 31.4 33.5 24.7 28.4 Converting this sequence of numbers to a sequence of symbols A and B, where A indicates a value above the median and B denotes a value below the median gives ABABABABAABB. Test the sequence for randomness about the median with a 5% level of significance. Verify that the number of runs is 10. What is the upper critical value c2? arrow_forwardSand and clay studies were conducted at a site in California. Twelve consecutive depths, each about 15 cm deep, were studied and the following percentages of sand in the soil were recorded. 34.4 27.1 30.8 28.0 32.2 27.6 32.8 25.2 31.4 33.5 24.7 28.4 Converting this sequence of numbers to a sequence of symbols A and B, where A indicates a value above the median and B denotes a value below the median gives ABABABABAABB. Test the sequence for randomness about the median with a 5% level of significance. Verify that the number of runs is 10. What is the upper critical value c2?arrow_forward
- 29% of all college students major in STEM (Science, Technology, Engineering, and Math). If 46 college students are randomly selected, find the probability thata. Exactly 11 of them major in STEM. b. At most 12 of them major in STEM. c. At least 11 of them major in STEM. d. Between 11 and 15 (including 11 and 15) of them major in STEM.arrow_forwardSand and clay studies were conducted at a site in California. Twelve consecutive depths, each about 15 cm deep, were studied and the following percentages of sand in the soil were recorded. 27.3 34.6 30.6 27.8 33.4 31.5 27.3 31.2 32.0 24.7 24.4 28.2 Test this sequence for randomness about the median. Converting this sequence of numbers to a sequence of symbols A and B, where A indicates a value above the median and B denotes a value below the median gives BAABAABAABBB. Verify that the number of runs is 7, the lower critical number is 3, and the upper critical number is 11. Use a 5% level of significance. State the conclusion of the test and interpret your results.arrow_forward29% of all college students major in STEM (Science, Technology, Engineering, and Math). If 46 college students are randomly selected, find the probability thata. Exactly 11 of them major in STEM. b. At most 12 of them major in STEM. c. At least 11 of them major in STEM. d. Between 11 and 15 (including 11 and 15) of them major in STEM.arrow_forward
- Please solving problem2 Problem1 We consider a two-period binomial model with the following properties: each period lastsone (1) year and the current stock price is S0 = 4. On each period, the stock price doubleswhen it moves up and is reduced by half when it moves down. The annual interest rateon the money market is 25%. (This model is the same as in Prob. 1 of HW#2).We consider four options on this market: A European call option with maturity T = 2 years and strike price K = 5; A European put option with maturity T = 2 years and strike price K = 5; An American call option with maturity T = 2 years and strike price K = 5; An American put option with maturity T = 2 years and strike price K = 5.(a) Find the price at time 0 of both European options.(b) Find the price at time 0 of both American options. Compare your results with (a)and comment.(c) For each of the American options, describe the optimal exercising strategy.arrow_forwardProblem 1.We consider a two-period binomial model with the following properties: each period lastsone (1) year and the current stock price is S0 = 4. On each period, the stock price doubleswhen it moves up and is reduced by half when it moves down. The annual interest rateon the money market is 25%. We consider four options on this market: A European call option with maturity T = 2 years and strike price K = 5; A European put option with maturity T = 2 years and strike price K = 5; An American call option with maturity T = 2 years and strike price K = 5; An American put option with maturity T = 2 years and strike price K = 5.(a) Find the price at time 0 of both European options.(b) Find the price at time 0 of both American options. Compare your results with (a)and comment.(c) For each of the American options, describe the optimal exercising strategy.(d) We assume that you sell the American put to a market participant A for the pricefound in (b). Explain how you act on the market…arrow_forwardWhat is the standard scores associated to the left of z is 0.1446arrow_forward
- Note: The purpose of this problem below is to use computational techniques (Excelspreadsheet, Matlab, R, Python, etc.) and code the dynamic programming ideas seen inclass. Please provide the numerical answer to the questions as well as a sample of yourwork (spreadsheet, code file, etc.).We consider an N-period binomial model with the following properties: N = 60, thecurrent stock price is S0 = 1000; on each period, the stock price increases by 0.5% whenit moves up and decreases by 0.3% when it moves down. The annual interest rate on themoney market is 5%. (Notice that this model is a CRR model, which means that thebinomial tree is recombining.)(a) Find the price at time t0 = 0 of a (European) call option with strike price K = 1040and maturity T = 1 year.(b) Find the price at time t0 = 0 of a (European) put option with strike price K = 1040and maturity T = 1 year.(c) We consider now, that you are at time t5 (i.e. after 5 periods, which represents 1month later). Assume that the stock…arrow_forwardshow work in paperarrow_forwardshow all work (...or what you entered into your calculator...)arrow_forward
 Glencoe Algebra 1, Student Edition, 9780079039897...AlgebraISBN:9780079039897Author:CarterPublisher:McGraw Hill
 Big Ideas Math A Bridge To Success Algebra 1: Stu...AlgebraISBN:9781680331141Author:HOUGHTON MIFFLIN HARCOURTPublisher:Houghton Mifflin Harcourt
 Algebra and Trigonometry (MindTap Course List)AlgebraISBN:9781305071742Author:James Stewart, Lothar Redlin, Saleem WatsonPublisher:Cengage Learning
 Holt Mcdougal Larson Pre-algebra: Student Edition...AlgebraISBN:9780547587776Author:HOLT MCDOUGALPublisher:HOLT MCDOUGAL
 College Algebra (MindTap Course List)AlgebraISBN:9781305652231Author:R. David Gustafson, Jeff HughesPublisher:Cengage Learning
 Algebra & Trigonometry with Analytic GeometryAlgebraISBN:9781133382119Author:SwokowskiPublisher:Cengage