
Ten Lessons in Introductory Sociology
2nd Edition
ISBN: 9780190663872
Author: Kenneth A. Gould; Tammy L. Lewis
Publisher: Oxford University Press Academic US
expand_more
expand_more
format_list_bulleted
Concept explainers
Videos
Textbook Question
Chapter 4, Problem 15SE
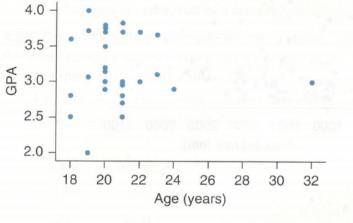
Do Older Students Have Higher GPAs? On the basis of the
Expert Solution & Answer
Want to see the full answer?
Check out a sample textbook solution
Students have asked these similar questions
Find the critical value for a left-tailed test using the F distribution with a 0.025, degrees of freedom in the numerator=12, and degrees of freedom in the
denominator = 50. A portion of the table of critical values of the F-distribution is provided.
Click the icon to view the partial table of critical values of the F-distribution.
What is the critical value?
(Round to two decimal places as needed.)
A retail store manager claims that the average daily sales of the store are $1,500.
You aim to test whether the actual average daily sales differ significantly from this claimed value.
You can provide your answer by inserting a text box and the answer must include:
Null hypothesis,
Alternative hypothesis,
Show answer (output table/summary table), and
Conclusion based on the P value.
Showing the calculation is a must. If calculation is missing,so please provide a step by step on the answers
Numerical answers in the yellow cells
Show all work
Chapter 4 Solutions
Ten Lessons in Introductory Sociology
Ch. 4 - Predicting Land Value Both scatterplots concern...Ch. 4 - Predicting Total Value of Property Both...Ch. 4 - Car Value and Age of Student The scatterplot shows...Ch. 4 - Shoe Size and GPA The figure shows a scatterplot...Ch. 4 - Weight Loss (Example 1) The scatterplot shows the...Ch. 4 - Comparing Salaries The scatterplot shows the...Ch. 4 - Sisters and Brothers The scatterplot shows the...Ch. 4 - BAs and Median Income The scatterplot shows data...Ch. 4 - Work and TV The scatterplot shows the number of...Ch. 4 - Work and Sleep The scatterplot shows the number of...
Ch. 4 - Age and Sleep The scatterplot shows the age and...Ch. 4 - Height and Weight for Women The figure shows a...Ch. 4 - College Tuition and ACT a. The first scatterplot...Ch. 4 - Ages of Women Who Give Birth The figure shows a...Ch. 4 - Do Older Students Have Higher GPAs? On the basis...Ch. 4 - Handspans Refer to the figure. a. Would it make...Ch. 4 - Matching Pick the letter of the graph that goes...Ch. 4 - Matching Pick the letter of the graph that goes...Ch. 4 - Matching Match each of the following correlations...Ch. 4 - Matching Match each of the following correlations...Ch. 4 - Trash (Example 2) The table shows the number of...Ch. 4 - Cost of Flights The table for part a shows...Ch. 4 - Work Hour and TV Hours In Exercise 4.9 there was a...Ch. 4 - House Price The correlation between house price...Ch. 4 - Rate My Professor Seth Wagerman, a former...Ch. 4 - Cousins Five people were asked how many female...Ch. 4 - + Video Games and BMI The table gives some...Ch. 4 - See-Saw The table gives data on the heights (above...Ch. 4 - Salaries of College Graduates (Example 3) The...Ch. 4 - Mother and Daughter Heights The graph shows the...Ch. 4 - Are Men Paid More Than Women? The scatterplot...Ch. 4 - Home Prices and Areas of Four Bedroom Homes a....Ch. 4 - Height and Arm Span for Women (Example 4) TI-84...Ch. 4 - Hand and Foot Length for Women The computer output...Ch. 4 - Height and Arm Span for Men (Example 5)...Ch. 4 - Hand Length and Foot Length for Men Measurements...Ch. 4 - Comparing Correlation for Arm Span and Height The...Ch. 4 - Age and Weight for Men and Women The scatterplot...Ch. 4 - Social Security Number and Age The figure shows a...Ch. 4 - Seesaw The figure shows a scatterplot of the...Ch. 4 - Choosing the Predictor and Response (Example 6)...Ch. 4 - Choosing the Predictor and Response Indicate which...Ch. 4 - Percentage of Smoke-Free Homes and Percentage of...Ch. 4 - Effect of Adult Smoking on High School Student...Ch. 4 - Driver’s Deaths and Ages The figure shows a graph...Ch. 4 - Do Women Tend to Live Longer Than Men? The figure...Ch. 4 - How Is the Time of a Flight Related to the...Ch. 4 - English in California Schools This problem...Ch. 4 - Do States with Higher Populations Have More...Ch. 4 - Semesters and Units The table shows the...Ch. 4 - Pitchers The table shows the number of wins and...Ch. 4 - Text Messages The following table shows the number...Ch. 4 - Answer the question using complete sentence. a....Ch. 4 - Answer the question, using complete sentences. a....Ch. 4 - If there is a positive correlation between number...Ch. 4 - Suppose that the growth rate of children looks...Ch. 4 - Coefficient of Determination If the correlation...Ch. 4 - Coefficient of Determination Does a correlation of...Ch. 4 - Investing Some investors use a technique called...Ch. 4 - Blood Pressure Suppose a doctor telephones those...Ch. 4 - Salary and Year of Employment (Example 8) The...Ch. 4 - MPG: Highway and City The following figure shows...Ch. 4 - Cost of Turkeys The table shows the weights and...Ch. 4 - Iraq Casualties and Population of Hometowns The...Ch. 4 - Teachers’ Pay and Costs of Education (Example 9)...Ch. 4 - Teachers’ Pay the figure shows a scatterplot with...Ch. 4 - Does Having a Job Affect Students’ Grades?...Ch. 4 - Weight of Trash and Household Size Data were...Ch. 4 - Age and Text Messages The scatterplot shows the...Ch. 4 - Life Expectancy and TVs The scatterplot shows the...Ch. 4 - Education of Fathers and Mothers The data shown in...Ch. 4 - Heights of Fathers and Sons The table shows some...Ch. 4 - Test Scores Assume that in a political science...Ch. 4 - Test Scores Assume that in a sociology class, the...Ch. 4 - Heights and Weights of People The following table...Ch. 4 - Heights and Weights of Men The table shows the...Ch. 4 - Homes The table shows the asking price (in...Ch. 4 - Alcohol and Calories in Beer At the text’s website...Ch. 4 - Shoe Size and Height The scatterplot shows the...Ch. 4 - Age and Sleep The following scatterplot shows the...Ch. 4 - Age and Weight The following scatterplot shows the...Ch. 4 - Heights and Test Scores a. The following figure...Ch. 4 - Prob. 83CRECh. 4 - Age and Happiness Happiness ratings were from I...Ch. 4 - Tree Heights Loggers gathered information about...Ch. 4 - Film Budgets and Grosses Movie studios exert much...Ch. 4 - Gas Mileage of Cars The table gives the number of...Ch. 4 - Tall Buildings The following scatterplot shows...Ch. 4 - Bar-Passing Rate To become a lawyer, you must pass...Ch. 4 - For 4.91 through 4.94 show your points in a rough...Ch. 4 - For 4.91 through 4.94 show your points in a rough...Ch. 4 - For 4.91 through 4.94 show your points in a rough...Ch. 4 - For 4.91 through 4.94 show your points in a rough...Ch. 4 - The following figure shows a scatterplot of the...Ch. 4 - Wages and Education The figure shows a scatterplot...Ch. 4 - Do Students Taking More Units Study More Hours?...Ch. 4 - Hours of Exercise and Hours of Homework The...Ch. 4 - Children’s Ages and Heights The following figure...Ch. 4 - Blackjack Tips The following figure shows the...Ch. 4 - Decrease in Cholesterol A doctor is studying...Ch. 4 - Prob. 102CRE
Knowledge Booster


Learn more about
Need a deep-dive on the concept behind this application? Look no further. Learn more about this topic, statistics and related others by exploring similar questions and additional content below.Similar questions
- Show all workarrow_forwardplease find the answers for the yellows boxes using the information and the picture belowarrow_forwardA marketing agency wants to determine whether different advertising platforms generate significantly different levels of customer engagement. The agency measures the average number of daily clicks on ads for three platforms: Social Media, Search Engines, and Email Campaigns. The agency collects data on daily clicks for each platform over a 10-day period and wants to test whether there is a statistically significant difference in the mean number of daily clicks among these platforms. Conduct ANOVA test. You can provide your answer by inserting a text box and the answer must include: also please provide a step by on getting the answers in excel Null hypothesis, Alternative hypothesis, Show answer (output table/summary table), and Conclusion based on the P value.arrow_forward
- A company found that the daily sales revenue of its flagship product follows a normal distribution with a mean of $4500 and a standard deviation of $450. The company defines a "high-sales day" that is, any day with sales exceeding $4800. please provide a step by step on how to get the answers Q: What percentage of days can the company expect to have "high-sales days" or sales greater than $4800? Q: What is the sales revenue threshold for the bottom 10% of days? (please note that 10% refers to the probability/area under bell curve towards the lower tail of bell curve) Provide answers in the yellow cellsarrow_forwardBusiness Discussarrow_forwardThe following data represent total ventilation measured in liters of air per minute per square meter of body area for two independent (and randomly chosen) samples. Analyze these data using the appropriate non-parametric hypothesis testarrow_forward
arrow_back_ios
SEE MORE QUESTIONS
arrow_forward_ios
Recommended textbooks for you
 Glencoe Algebra 1, Student Edition, 9780079039897...AlgebraISBN:9780079039897Author:CarterPublisher:McGraw Hill
 Big Ideas Math A Bridge To Success Algebra 1: Stu...AlgebraISBN:9781680331141Author:HOUGHTON MIFFLIN HARCOURTPublisher:Houghton Mifflin Harcourt
 Holt Mcdougal Larson Pre-algebra: Student Edition...AlgebraISBN:9780547587776Author:HOLT MCDOUGALPublisher:HOLT MCDOUGAL
 Algebra and Trigonometry (MindTap Course List)AlgebraISBN:9781305071742Author:James Stewart, Lothar Redlin, Saleem WatsonPublisher:Cengage Learning
Glencoe Algebra 1, Student Edition, 9780079039897...
Algebra
ISBN:9780079039897
Author:Carter
Publisher:McGraw Hill
Big Ideas Math A Bridge To Success Algebra 1: Stu...
Algebra
ISBN:9781680331141
Author:HOUGHTON MIFFLIN HARCOURT
Publisher:Houghton Mifflin Harcourt
Holt Mcdougal Larson Pre-algebra: Student Edition...
Algebra
ISBN:9780547587776
Author:HOLT MCDOUGAL
Publisher:HOLT MCDOUGAL
Algebra and Trigonometry (MindTap Course List)
Algebra
ISBN:9781305071742
Author:James Stewart, Lothar Redlin, Saleem Watson
Publisher:Cengage Learning
Correlation Vs Regression: Difference Between them with definition & Comparison Chart; Author: Key Differences;https://www.youtube.com/watch?v=Ou2QGSJVd0U;License: Standard YouTube License, CC-BY
Correlation and Regression: Concepts with Illustrative examples; Author: LEARN & APPLY : Lean and Six Sigma;https://www.youtube.com/watch?v=xTpHD5WLuoA;License: Standard YouTube License, CC-BY