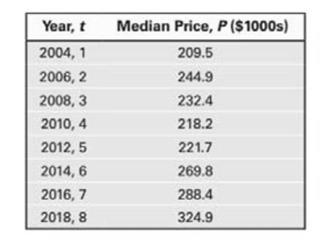
Housing Prices The data in the table on the right represents the January median new-home prices in the United states for the years shown. ( a ) With a graphing utility, draw a scatter plot of the data. Comment on the type of relation that appears to exist between the two variables. ( b ) Decide on the function of best fit to these data ( linear, quadratic, or cubic ) , and use this function to predict the median new-phone price in the United States for January 2022 ( t = 10 ) . ( c ) Draw the function of best fit on the scatter plot obtained in part ( a ) .
Housing Prices The data in the table on the right represents the January median new-home prices in the United states for the years shown. ( a ) With a graphing utility, draw a scatter plot of the data. Comment on the type of relation that appears to exist between the two variables. ( b ) Decide on the function of best fit to these data ( linear, quadratic, or cubic ) , and use this function to predict the median new-phone price in the United States for January 2022 ( t = 10 ) . ( c ) Draw the function of best fit on the scatter plot obtained in part ( a ) .
Solution Summary: The author explains how to sketch the graph using graphing calculator using the steps below.
Housing Prices The data in the table on the right represents the January median new-home prices in the United states for the years shown.
(
a
)
With a graphing utility, draw a scatter plot of the data. Comment on the type of relation that appears to exist between the two variables.
(
b
)
Decide on the function of best fit to these data
(
linear, quadratic, or cubic
)
, and use this function to predict the median new-phone price in the United States for January
2022
(
t
=
10
)
.
(
c
)
Draw the function of best fit on the scatter plot obtained in part
(
a
)
.
Definition Definition Representation of the direction and degree of correlation in graphical form. The grouping of points that are plotted makes it a scatter diagram. A line can be drawn showing the relationship based on the direction of points and their distance from each other.
Use the properties of logarithms, given that In(2) = 0.6931 and In(3) = 1.0986, to approximate the logarithm. Use a calculator to confirm your approximations. (Round your answers to four decimal places.)
(a) In(0.75)
(b) In(24)
(c) In(18)
1
(d) In
≈
2
72
Find the indefinite integral. (Remember the constant of integration.)
√tan(8x)
tan(8x) sec²(8x) dx
Need a deep-dive on the concept behind this application? Look no further. Learn more about this topic, calculus and related others by exploring similar questions and additional content below.


 Glencoe Algebra 1, Student Edition, 9780079039897...AlgebraISBN:9780079039897Author:CarterPublisher:McGraw Hill
 Holt Mcdougal Larson Pre-algebra: Student Edition...AlgebraISBN:9780547587776Author:HOLT MCDOUGALPublisher:HOLT MCDOUGAL
 Big Ideas Math A Bridge To Success Algebra 1: Stu...AlgebraISBN:9781680331141Author:HOUGHTON MIFFLIN HARCOURTPublisher:Houghton Mifflin Harcourt
 College AlgebraAlgebraISBN:9781305115545Author:James Stewart, Lothar Redlin, Saleem WatsonPublisher:Cengage Learning
 Functions and Change: A Modeling Approach to Coll...AlgebraISBN:9781337111348Author:Bruce Crauder, Benny Evans, Alan NoellPublisher:Cengage Learning