
Videos
Industrial experiment Engineers at a computer production plant tested two methods for accuracy in drilling holes into a PC board. They tested how fast they could set the drilling machine by running 10 boards at each of two different speeds. To assess the results, they measured the distance (in inches) from the center of a target on the board to the center of the hole. The data and summary statistics are shown in the table:
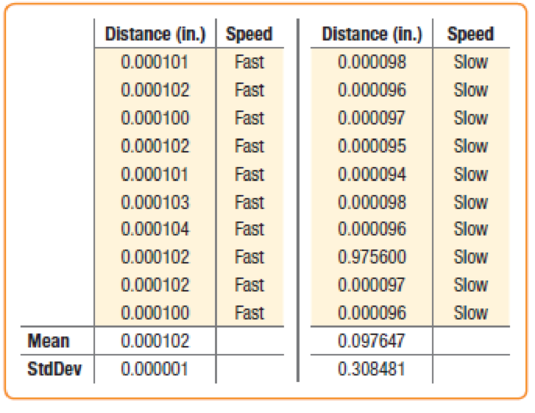
Write a report summarizing the findings of the experiment. Include appropriate visual and verbal displays of the distributions, and make a recommendation to the engineers if they are most interested in the accuracy of the method.
Want to see the full answer?
Check out a sample textbook solution
Chapter 4 Solutions
Intro Stats, Books a la Carte Edition (5th Edition)
Additional Math Textbook Solutions
The Practice of Statistics for AP - 4th Edition
Elementary Statistics: A Step By Step Approach
Statistical Reasoning for Everyday Life (5th Edition)
Essential Statistics
Business Statistics: A First Course (7th Edition)
Research Methods for the Behavioral Sciences (MindTap Course List)


- Find the mean hourly cost when the cell phone described above is used for 240 minutes.arrow_forwardOne operation of a mill is to cut pieces of steel into parts that will later be used as the frame for front seats in an automobile. The steel is cut with a diamond saw and requires the resulting parts to be within 10.005 inch of the length specified by the automobile company. Data are collected from a sample of 50 steel parts and are shown in the following table. The measurement reported is the difference in inches between the actual length of the steel part, as measured by a laser measurement device, and the specified length of the steel part. For example, the first value, -0.003, represents a steel part that is 0.003 inch shorter than the specified length. Complete parts a through c Click the icon to view the data table. a. Construct a frequency distribution Difference in Length -0.005 but less than -0.003: -0.003but less than -0.001 -0.001but less than 0.001 0.001but less than 0.003 0.003but less than 0.005 Frequency Difference Between Actual and Specified Lengths 0.002 0 -0.003…arrow_forwardA student releases a ball on a ramp, letting it roll down the ramp. Using a meter stick, she measureshow far it rolls in half of a second. She then repeats this process, increasing the time she allows the ball to rollwith each trial. The data is given below:Time (s) Distance (cm)0.0 00.5 51.0 251.5 552.0 1002.5 1553.0 2253.5 3054.0 4004.5 5055.0 6251. What is the independent variable for the experiment?2. What is the dependent variable for the experiment?arrow_forward
- The Kentucky Department of Agriculture is concerned about the number of acres of farmland being withdrawn from farming. The department would like to propose new legislation to prevent this but wants to show the legislature what would happen if it does not act. Drew Johnson, the department’s statistician, regresses the number of acres used for farming in the state on time. Johnson finds the following: Model R R Square Adjusted R Square Std. Error of the Estimate 1 .943a .890 .795 3.2875 Predictors: (Constant), Number of Years Model Sum of Squares df Mean Square F Sig. 1 Regression 1378.458 1 1378.458 141.149 .000a Residual 478.567 49 9.766 9.766 Total 1857.025 50 Predictors: (Constant), Number of Years Dependent Variable: Acres (in Millions) Unstandardized Standardized B Std. Error Beta t Sig. 1 constant 2.743 .357…arrow_forwardTo test a newly formulated protein bar designed to improve running performance, 10 distance runners performed two trials. All the participants ate the new protein formula bar on the first trial. In the second trial, the same participants ate the regular (old) protein bar. Thirty minutes after consuming the bar the participant ran for 2 hours on a treadmill. At the end of the two trials, performed on consecutive days for each participant, the distance each participant ran (in km) was recorded. The data is below. Runner New formula Old formula 1 10.6 10.5 2 11.2 10.9 3 10.3 10.2 4 11.9 11.6 5 9.8 9.7 6 11.1 10.8 7 12.1 11.9 8 10.9 10.8 9 9.7 9.8 10 10.3 10.3 a) Calculate a 99% confidence interval for the population mean difference in run distance after eating the newly formulated protein bar compared to the old protein bar. b) Carry out the appropriate hypothesis test using a two-sided…arrow_forwardA semiconductor manufacturer produces devices used as central processing units in personal computers. The speed of two model devices, measured in megahertz, is important because it determines the price that the manufacturer can charge for the devices. The following data presents the measurement on 20 devices each for the two models. Model A: 680 670 710 669 669 719 699 722 663 658 634 720 690 677 700 718 690 681 702 Model B: 652 720 660 695 701 724 668 698 668 660 680 739 717 727 653 637 660 693 679 a. Which of the two models is relatively faster? What is your basis for stating such? b. If you were to choose which between the two models you are going to use as central processing unit in a personal computer, which would it be and why? Support your answer statistically.arrow_forward
- Hand written please. An investigator wants to assess the association between manganese and blood pressure in pregnant women (side note: this is a study I am currently working on). The study plans to enroll 100 pregnant women. During the third trimester, each participant will have their manganese level and systolic blood pressure measured. Identify the type of study design and briefly describe its strengths and weaknesses.arrow_forwardMr. Moore's physics class built different-shaped parachutes to see which shapes were more effective. The students tested the parachutes by dropping them from a height of 30 feet and timing the fall. They calculated the summary below: Mean Std Dev Min Q1 Median Q3 Max 5.6 secs 0.6 sec 3.3 secs 4.5 secs 4.8 secs 5.2 secs 7.8 secs The students wanted to see what happens to their times when they drop the parachutes from 45 feet. They find that every drop is increased by 2.5 seconds. Find the new mean and standard deviation. Mean, 3.1 seconds; standard deviation, 0.6 second Mean, 5.6 seconds; standard deviation, 3.1 seconds Mean, 5.6 seconds; standard deviation, −1.9 seconds or Mean, 8.1 seconds; standard deviation, 0.6 secondarrow_forwardThe Kentucky Department of Agriculture is concerned about the number of acres of farmland being withdrawn from farming. The department would like to propose new legislation to prevent this but wants to show the legislature what would happen if it does not act. Drew Johnson, the department’s statistician, regresses the number of acres used for farming in the state on time. Johnson finds the following: Model Summary Model R R Square Adjusted R Square Std. Error of the Estimate 1 .943a .890 .795 3.2875 a. Predictors: (Constant), Number of Years ANOVAb Model Sum of Squares df Mean Square F Sig. 1 Regression 1378.458 1 1378.458 141.149 .000a Residual 478.567 49 9.766 Total 1857.025 50 a. Predictors: (Constant), Number of Years b. Dependent Variable: Acres (in Millions) Coefficientsa Model Unstandardized Coefficients Standardized Coefficients t Sig.…arrow_forward
- If you drive from New York to Boston at 55 MPH, and return at 75 MPH. What is your overall average speed?arrow_forwardA comparative Psychologist tests the amount of time it takes for mice to complete a maze as their dependent variable. What type of data would this be? a. ratio b. interval c. ordinal d. nominalarrow_forwardFind the margin of error for the given data values of c,s and n C = 0.92, s = 460 and n = 42 Round to two decimalsarrow_forward
 Glencoe Algebra 1, Student Edition, 9780079039897...AlgebraISBN:9780079039897Author:CarterPublisher:McGraw Hill
 College Algebra (MindTap Course List)AlgebraISBN:9781305652231Author:R. David Gustafson, Jeff HughesPublisher:Cengage Learning
 Holt Mcdougal Larson Pre-algebra: Student Edition...AlgebraISBN:9780547587776Author:HOLT MCDOUGALPublisher:HOLT MCDOUGAL