
Intro Stats, Books a la Carte Edition (5th Edition)
5th Edition
ISBN: 9780134210285
Author: Richard D. De Veaux, Paul Velleman, David E. Bock
Publisher: PEARSON
expand_more
expand_more
format_list_bulleted
Videos
Textbook Question
Chapter 4, Problem 10E
Exoplanets re-expressed Here are the exoplanet distances of Exercise 9, re-expressed to the log scale:
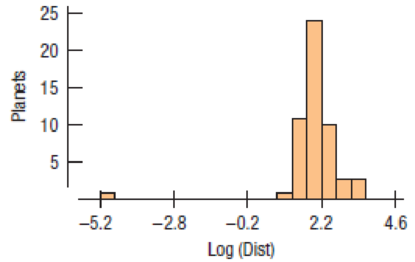
- a) Is this a better scale to understand these distances?
- b) The low outlier is “sol”– that is, it is the distance of the sun from the earth. Do you think it belongs with these data?
Expert Solution & Answer
Want to see the full answer?
Check out a sample textbook solution
Students have asked these similar questions
08:34
◄ Classroom
07:59
Probs. 5-32/33
D
ا.
89
5-34. Determine the horizontal and vertical components
of reaction at the pin A and the normal force at the smooth
peg B on the member.
A
0,4 m
0.4 m
Prob. 5-34
F=600 N
fr
th
ar
0.
163586
5-37. The wooden plank resting between the buildings
deflects slightly when it supports the 50-kg boy. This
deflection causes a triangular distribution of load at its ends.
having maximum intensities of w, and wg. Determine w
and wg. each measured in N/m. when the boy is standing
3 m from one end as shown. Neglect the mass of the plank.
0.45 m
3 m
Examine the Variables: Carefully review and note the names of all variables in the dataset. Examples of these variables include:
Mileage (mpg)
Number of Cylinders (cyl)
Displacement (disp)
Horsepower (hp)
Research: Google to understand these variables.
Statistical Analysis: Select mpg variable, and perform the following statistical tests. Once you are done with these tests using mpg variable, repeat the same with hp
Mean
Median
First Quartile (Q1)
Second Quartile (Q2)
Third Quartile (Q3)
Fourth Quartile (Q4)
10th Percentile
70th Percentile
Skewness
Kurtosis
Document Your Results:
In RStudio: Before running each statistical test, provide a heading in the format shown at the bottom. “# Mean of mileage – Your name’s command”
In Microsoft Word: Once you've completed all tests, take a screenshot of your results in RStudio and paste it into a Microsoft Word document. Make sure that snapshots are very clear. You will need multiple snapshots. Also transfer these results to the…
Chapter 4 Solutions
Intro Stats, Books a la Carte Edition (5th Edition)
Ch. 4.1 - The Bureau of Transportation Statistics of the...Ch. 4.1 - The Bureau of Transportation Statistics of the...Ch. 4.1 - Prob. 3JCCh. 4 - Load factors 2016 The Research and Innovative...Ch. 4 - Load factors, 2016 by season We can also compare...Ch. 4 - Prob. 3ECh. 4 - Prisons 2014 In a way, boxplots are the opposite...Ch. 4 - Load factors 2016 by month Here is a display of...Ch. 4 - Prob. 6ECh. 4 - Prob. 7E
Ch. 4 - Prob. 8ECh. 4 - Prob. 9ECh. 4 - Exoplanets re-expressed Here are the exoplanet...Ch. 4 - Pizza prices by city (Data in Pizza prices) The...Ch. 4 - Cost of living 2016, selected cities To help...Ch. 4 - Prob. 16ECh. 4 - Prob. 17ECh. 4 - Slalom times 2014 The Mens Giant Slalom skiing...Ch. 4 - Sugar in cereals Sugar is a major ingredient in...Ch. 4 - Tendon transfers People with spinal cord injuries...Ch. 4 - Population growth, 2010 by region (Data in...Ch. 4 - Camp sites Shown below are the histogram and...Ch. 4 - Hospital stays The U.S. National Center for Health...Ch. 4 - Deaths 2014 A National Vital Statistics Report...Ch. 4 - Womens basketball Here are boxplots of the points...Ch. 4 - Prob. 26ECh. 4 - Marriage age In 1975, did men and women marry at...Ch. 4 - Fuel economy and cylinders Describe what these...Ch. 4 - Prob. 29ECh. 4 - Ozone Ozone levels (in parts per billion, ppb)...Ch. 4 - Test scores Three statistics classes all took the...Ch. 4 - Prob. 32ECh. 4 - Graduation? A survey of major universities asked...Ch. 4 - Vineyards Here are summary statistics for the...Ch. 4 - Caffeine A student study of the effects of...Ch. 4 - SAT scores Here are the summary statistics for...Ch. 4 - Prob. 37ECh. 4 - Framingham cholesterol The Framingham Heart Study...Ch. 4 - Prob. 39ECh. 4 - Cloud seeding In an experiment to determine...Ch. 4 - Industrial experiment Engineers at a computer...Ch. 4 - Cholesterol and smoking A study that examined the...Ch. 4 - Prob. 43ECh. 4 - Assets Here is a histogram of the assets (in...Ch. 4 - Prob. 46ECh. 4 - Assets again Here are the same data you saw in...Ch. 4 - Rainmakers The table lists the amounts of rainfall...Ch. 4 - Stereograms Stereograms appear to be composed...Ch. 4 - Stereograms, revisited Because of the skewness of...Ch. 4 - Prob. 51ECh. 4 - Prob. 52E
Additional Math Textbook Solutions
Find more solutions based on key concepts
Provide an example of a qualitative variable and an example of a quantitative variable.
Elementary Statistics ( 3rd International Edition ) Isbn:9781260092561
Let F be a continuous distribution function. If U is uniformly distributed on (0,1), find the distribution func...
A First Course in Probability (10th Edition)
For Problems 23-28, write in simpler form, as in Example 4. logbFG
Finite Mathematics for Business, Economics, Life Sciences and Social Sciences
The largest polynomial that divides evenly into a list of polynomials is called the _______.
Elementary & Intermediate Algebra
The first derivative of function y=25x4.
Calculus for Business, Economics, Life Sciences, and Social Sciences (14th Edition)
1. How is a sample related to a population?
Elementary Statistics: Picturing the World (7th Edition)
Knowledge Booster


Learn more about
Need a deep-dive on the concept behind this application? Look no further. Learn more about this topic, statistics and related others by exploring similar questions and additional content below.Similar questions
- Examine the Variables: Carefully review and note the names of all variables in the dataset. Examples of these variables include: Mileage (mpg) Number of Cylinders (cyl) Displacement (disp) Horsepower (hp) Research: Google to understand these variables. Statistical Analysis: Select mpg variable, and perform the following statistical tests. Once you are done with these tests using mpg variable, repeat the same with hp Mean Median First Quartile (Q1) Second Quartile (Q2) Third Quartile (Q3) Fourth Quartile (Q4) 10th Percentile 70th Percentile Skewness Kurtosis Document Your Results: In RStudio: Before running each statistical test, provide a heading in the format shown at the bottom. “# Mean of mileage – Your name’s command” In Microsoft Word: Once you've completed all tests, take a screenshot of your results in RStudio and paste it into a Microsoft Word document. Make sure that snapshots are very clear. You will need multiple snapshots. Also transfer these results to the…arrow_forward2 (VaR and ES) Suppose X1 are independent. Prove that ~ Unif[-0.5, 0.5] and X2 VaRa (X1X2) < VaRa(X1) + VaRa (X2). ~ Unif[-0.5, 0.5]arrow_forward8 (Correlation and Diversification) Assume we have two stocks, A and B, show that a particular combination of the two stocks produce a risk-free portfolio when the correlation between the return of A and B is -1.arrow_forward
- 9 (Portfolio allocation) Suppose R₁ and R2 are returns of 2 assets and with expected return and variance respectively r₁ and 72 and variance-covariance σ2, 0%½ and σ12. Find −∞ ≤ w ≤ ∞ such that the portfolio wR₁ + (1 - w) R₂ has the smallest risk.arrow_forward7 (Multivariate random variable) Suppose X, €1, €2, €3 are IID N(0, 1) and Y2 Y₁ = 0.2 0.8X + €1, Y₂ = 0.3 +0.7X+ €2, Y3 = 0.2 + 0.9X + €3. = (In models like this, X is called the common factors of Y₁, Y₂, Y3.) Y = (Y1, Y2, Y3). (a) Find E(Y) and cov(Y). (b) What can you observe from cov(Y). Writearrow_forward1 (VaR and ES) Suppose X ~ f(x) with 1+x, if 0> x > −1 f(x) = 1−x if 1 x > 0 Find VaRo.05 (X) and ES0.05 (X).arrow_forward
- Joy is making Christmas gifts. She has 6 1/12 feet of yarn and will need 4 1/4 to complete our project. How much yarn will she have left over compute this solution in two different ways arrow_forwardSolve for X. Explain each step. 2^2x • 2^-4=8arrow_forwardOne hundred people were surveyed, and one question pertained to their educational background. The results of this question and their genders are given in the following table. Female (F) Male (F′) Total College degree (D) 30 20 50 No college degree (D′) 30 20 50 Total 60 40 100 If a person is selected at random from those surveyed, find the probability of each of the following events.1. The person is female or has a college degree. Answer: equation editor Equation Editor 2. The person is male or does not have a college degree. Answer: equation editor Equation Editor 3. The person is female or does not have a college degree.arrow_forward
arrow_back_ios
SEE MORE QUESTIONS
arrow_forward_ios
Recommended textbooks for you
 Algebra & Trigonometry with Analytic GeometryAlgebraISBN:9781133382119Author:SwokowskiPublisher:Cengage
 Trigonometry (MindTap Course List)TrigonometryISBN:9781337278461Author:Ron LarsonPublisher:Cengage Learning
 Big Ideas Math A Bridge To Success Algebra 1: Stu...AlgebraISBN:9781680331141Author:HOUGHTON MIFFLIN HARCOURTPublisher:Houghton Mifflin Harcourt
 Glencoe Algebra 1, Student Edition, 9780079039897...AlgebraISBN:9780079039897Author:CarterPublisher:McGraw Hill
Algebra & Trigonometry with Analytic Geometry
Algebra
ISBN:9781133382119
Author:Swokowski
Publisher:Cengage
Trigonometry (MindTap Course List)
Trigonometry
ISBN:9781337278461
Author:Ron Larson
Publisher:Cengage Learning
Big Ideas Math A Bridge To Success Algebra 1: Stu...
Algebra
ISBN:9781680331141
Author:HOUGHTON MIFFLIN HARCOURT
Publisher:Houghton Mifflin Harcourt
Glencoe Algebra 1, Student Edition, 9780079039897...
Algebra
ISBN:9780079039897
Author:Carter
Publisher:McGraw Hill
Hypothesis Testing using Confidence Interval Approach; Author: BUM2413 Applied Statistics UMP;https://www.youtube.com/watch?v=Hq1l3e9pLyY;License: Standard YouTube License, CC-BY
Hypothesis Testing - Difference of Two Means - Student's -Distribution & Normal Distribution; Author: The Organic Chemistry Tutor;https://www.youtube.com/watch?v=UcZwyzwWU7o;License: Standard Youtube License