Fundamentals of Financial Management, Concise Edition (MindTap Course List)
9th Edition
ISBN: 9781305635937
Author: Eugene F. Brigham, Joel F. Houston
Publisher: Cengage Learning
expand_more
expand_more
format_list_bulleted
Concept explainers
Videos
Textbook Question
Chapter 4, Problem 3DQ
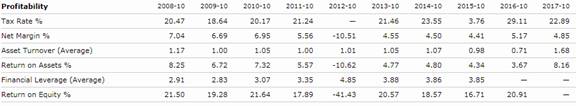
Looking at Morningstar’s Profitability ratios, what has happened to Hewlett Packard’s profit margin (net margin %) over the past 10 years? What has happened to its
Expert Solution & Answer
Want to see the full answer?
Check out a sample textbook solution
Students have asked these similar questions
What should the value of this share be on these accounting question?
What was the growth rate in Net Income over the previous 5 year period if the company's profits grew from $1.50 per share to $2.26 per share?
The Stieben Company has determined that the following will be true next year:
T(ratio of total assets of sales)=1
P(net profit of margin)=5%
d(dividend pay out ratio)=50%
L(debt equity ratio)=1
a) What is Stieben's sustainable growth rate in sales?
b)Can Stieben's actual growth rate in sales be different from its sustainable growth rate?
Why or why not?
c) How can Stieben change its sustainable growth?
Chapter 4 Solutions
Fundamentals of Financial Management, Concise Edition (MindTap Course List)
Ch. 4 - Financial ratio analysis is conducted by three...Ch. 4 - Prob. 2QCh. 4 - Over the past year, M.D. Ryngaert Co. had an...Ch. 4 - Profit margins and turnover ratios vary from one...Ch. 4 - How does inflation distort ratio analysis...Ch. 4 - Prob. 6QCh. 4 - Give some examples that illustrate how (a)...Ch. 4 - Why is it sometimes misleading to compare a...Ch. 4 - Suppose you were comparing a discount merchandiser...Ch. 4 - Prob. 10Q
Ch. 4 - Differentiate between ROE and ROIC.Ch. 4 - Indicate the effects of the transactions listed in...Ch. 4 - DAYS SALES OUTSTANDING Baxley Brothers has a DSO...Ch. 4 - DEBT TO CAPITAL RATIO Kayes Kitchenware has a...Ch. 4 - DuPONT ANALYSIS Hendersons Hardware has an ROA of...Ch. 4 - MARKET/BOOK RATIO Edelman Engines has 17 billion...Ch. 4 - PRICE/EARNINGS RATIO A company has an EPS of 2.40,...Ch. 4 - DuPONT AND ROE A firm has a profit margin of 3%...Ch. 4 - Prob. 7PCh. 4 - DuPONT AND NET INCOME Precious Metal Mining has 17...Ch. 4 - BEP, ROE, AND ROIC Broward Manufacturing recently...Ch. 4 - M/B AND SHARE PRICE You are given the following...Ch. 4 - RATIO CALCULATIONS Assume the following...Ch. 4 - Prob. 12PCh. 4 - TIE AND ROIC RATIOS The W.C. Pruett Corp. has...Ch. 4 - Prob. 14PCh. 4 - RETURN ON EQUITY AND QUICK RATIO Lloyd Inc. has...Ch. 4 - Prob. 16PCh. 4 - CONCEPTUAL: RETURN ON EQUITY Which of the...Ch. 4 - TIE RATIO MPI Incorporated has 6 billion in...Ch. 4 - CURRENT RATIO The Stewart Company has 2,392,500 in...Ch. 4 - DSO AND ACCOUNTS RECEIVABLE Ingraham Inc....Ch. 4 - Prob. 21PCh. 4 - Prob. 22PCh. 4 - RATIO ANALYSIS Data for Barry Computer Co. and its...Ch. 4 - DuPONT ANALYSIS A firm has been experiencing low...Ch. 4 - RATIO ANALYSIS The Corrigan Corporations 2015 and...Ch. 4 - Prob. 1DQCh. 4 - Prob. 2DQCh. 4 - Looking at Morningstars Profitability ratios, what...Ch. 4 - Prob. 4DQCh. 4 - Prob. 5DQCh. 4 - From the Google Finance site, look at Hewlett...Ch. 4 - From the Google Finance site, use the DuPont...Ch. 4 - Prob. 8DQ
Knowledge Booster


Learn more about
Need a deep-dive on the concept behind this application? Look no further. Learn more about this topic, finance and related others by exploring similar questions and additional content below.Similar questions
- Use the extended DuPont equation to provide a breakdown of Computrons projected return on equity. How does the projection compare with the previous years and with the industrys DuPont equation?arrow_forward3. What is the industry average price–earnings ratio? What is Ragan’s price–earnings ratio? Comment on any differences and explain why they may exist. 4. Assume the company’s growth rate declines to the industry average after five years. What percentage of the stock’s value is attributable to growth opportunities?arrow_forwardKimbi Limited had the following items on its balance sheet at the beginning of the year: Assets Cash Property Plant & Equipment Liabilities and equity $50,000 Debt $ 350,000 Equity $ 100, 000 $ 300,000 The net profit this year is $20, 000 with a dividend of $5, 750.arrow_forward
- Financial Accountingarrow_forwardCan you answer this accounting question?arrow_forwardUsing the Value Line Investment Survey report in Exhibit 11.5, find the following information for Apple. What was the amount of revenues (i.e., sales) generated by the company in 2017? What were the latest annual dividends per share and dividend yield? What is the earnings per share (EPS) projection for 2019? How many shares of common stock were outstanding? What were the book value per share and EPS in 2017? How much long-term debt did the company have in the third quarter of 2018?arrow_forward
- To get an overall picture of each company's capital structure, it is helpful to look at a the Key Ratios screen and then select the Financial Health tab. Common size balance sheet data are provided over a 10-year period. What, if any, are the major trends that emerge when you're looking at those data? Do those companies tend to have relatively high or relatively low levels of debt? Do these companies have significant levels of current liabilities? Have their capital structures changed over time? Use online resources to work on this chapter's questions. Please note that website information changes over time, and these changes may limit your ability to answer some of these questions. This chapter provides an overview of the effects of leverage and describes the process that firms use to determine their optimal capital structure. The chapter also indicates that capital structures tend to vary across industries and across countries. If you are interested in exploring these differences in more detail, the Morningstar website provides information about the capital structures of each of the companies it follows. The following discussion questions demonstrate how we can use this information to evaluate the capital structures for four restaurant companies: Cheesecake Factory (CAKE), Chipotle Mexican Grill (CMG), Ruby Tuesday (RT), and O'Charley's Inc. (CHUX).arrow_forwardYou observe that a firm's ROE has increased from the previous year, but both its profit margin and equity multiplier are below the previous year's levels. Which of the following statements is CORRECT? Its return on assets must be lower than the previous year. Its total assets turnover must be lower than the previous year. Its TIE ratio must be higher than the previous year. Its total assets turnover must be higher than the previous year.arrow_forward(Solving a comprehensive problem) Use the end-of-year stock price data in the popup window,, to answer the following questions for the Harris and Pinwheel companies. a. Compute the annual rates of return for each time period and for both firms. b. Calculate both the arithmetic and the geometric mean rates of return for the entire three-year period using your annual rates of return from part a. (Note: you may assume that neither firm pays any dividends.) c. Compute a three-year rate of return spanning the entire period (i.e., using the ending price for period 1 and ending price for period 4). d. Since the rate of return calculated in part c is a three-year rate of return, convert it to an annual rate of return by using the following equation: 1 + Three-Year Rate of Return 1 + Annual Rate of Return 3 e. How is the annual rate of return calculated in part d related to the geometric rate of return? When you are evaluating the performance of an investment that has been held for several…arrow_forward
- Using spreadsheet financial functions, calculate the following: Number of periodsPetcom’s 2021 earnings per share (EPS) were $2, and its growth rate during the prior 5 years was 9.0% per year. If that growth rate were maintained, how long would it take forthe company’s EPS to double?arrow_forwardWhat profit margin must the firm achieve ?arrow_forward(DuPont analysis) Bryley, Inc. earned a net profit margin of 4.5 percent last year and had an equity multiplier of 3.39. If its total assets are $99 million and its sales are $145 million, what is the firm's return on equity? The company's return on equity is%. (Round to one decimal place.)arrow_forward
arrow_back_ios
SEE MORE QUESTIONS
arrow_forward_ios
Recommended textbooks for you
 Fundamentals of Financial Management, Concise Edi...FinanceISBN:9781305635937Author:Eugene F. Brigham, Joel F. HoustonPublisher:Cengage Learning
 Intermediate Financial Management (MindTap Course...FinanceISBN:9781337395083Author:Eugene F. Brigham, Phillip R. DavesPublisher:Cengage Learning
 Fundamentals of Financial Management, Concise Edi...FinanceISBN:9781285065137Author:Eugene F. Brigham, Joel F. HoustonPublisher:Cengage Learning
 Fundamentals Of Financial Management, Concise Edi...FinanceISBN:9781337902571Author:Eugene F. Brigham, Joel F. HoustonPublisher:Cengage Learning
 Pfin (with Mindtap, 1 Term Printed Access Card) (...FinanceISBN:9780357033609Author:Randall Billingsley, Lawrence J. Gitman, Michael D. JoehnkPublisher:Cengage Learning
Fundamentals of Financial Management, Concise Edi...
Finance
ISBN:9781305635937
Author:Eugene F. Brigham, Joel F. Houston
Publisher:Cengage Learning
Intermediate Financial Management (MindTap Course...
Finance
ISBN:9781337395083
Author:Eugene F. Brigham, Phillip R. Daves
Publisher:Cengage Learning
Fundamentals of Financial Management, Concise Edi...
Finance
ISBN:9781285065137
Author:Eugene F. Brigham, Joel F. Houston
Publisher:Cengage Learning
Fundamentals Of Financial Management, Concise Edi...
Finance
ISBN:9781337902571
Author:Eugene F. Brigham, Joel F. Houston
Publisher:Cengage Learning
Pfin (with Mindtap, 1 Term Printed Access Card) (...
Finance
ISBN:9780357033609
Author:Randall Billingsley, Lawrence J. Gitman, Michael D. Joehnk
Publisher:Cengage Learning
Dividend disocunt model (DDM); Author: Edspira;https://www.youtube.com/watch?v=TlH3_iOHX3s;License: Standard YouTube License, CC-BY