
Concept explainers
Videos
Southwestern University: (B)*
*This integrated case study runs throughout the text. Other issues facing Southwestern’s football stadium include (A) managing the stadium project (Chapter 3); (C) quality of facilities (Chapter 6); (D) break-even analysis of food services (Supplement 7 web site): (E) locating the new stadium (Chapter 8 web site); (F) inventory planning of football programs (Chapter 12 web site); and (G)
Southwestern University (SWU), a large state college in Stephenville, Texas, enrolls close to 20,000 students. The school is a dominant force in the small city, with more students during fall and spring than permanent residents.
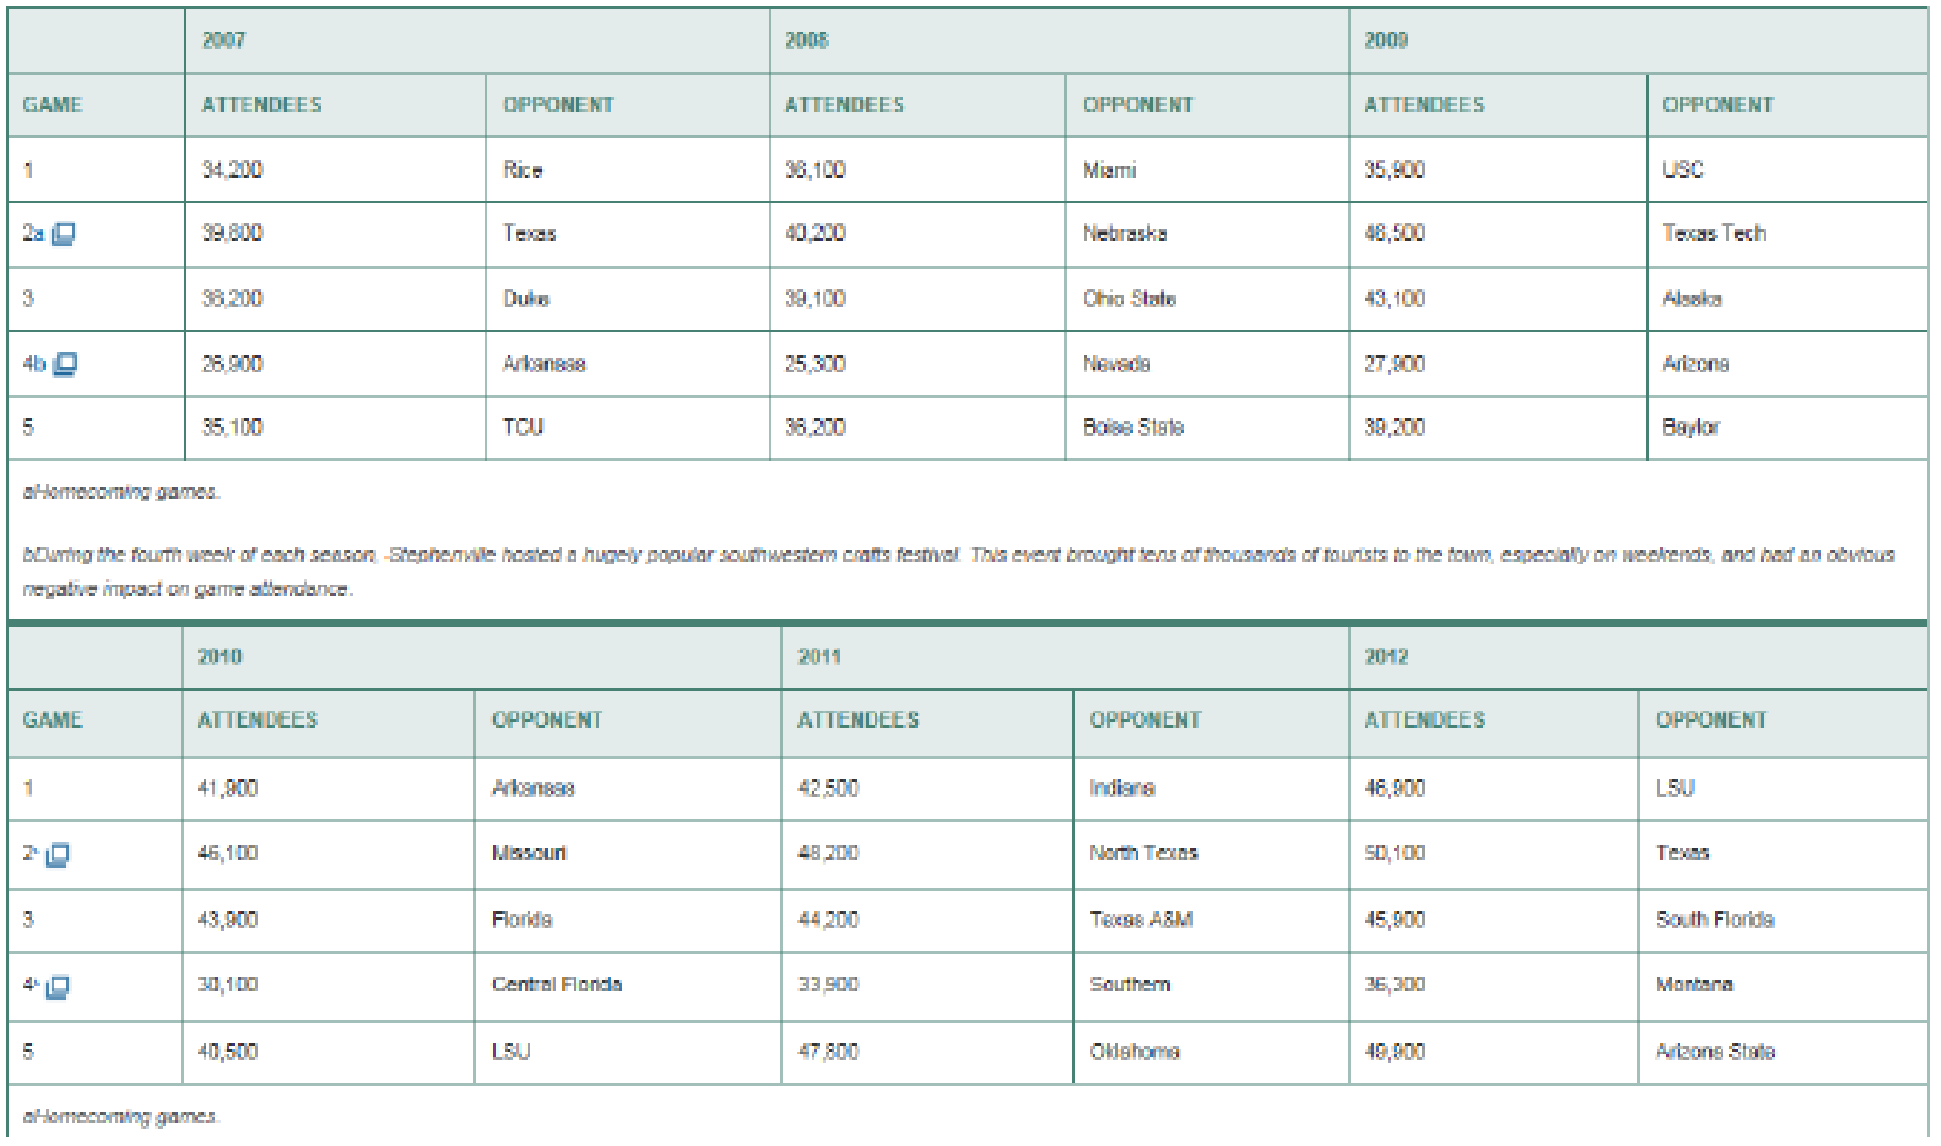
Always a football powerhouse, SWU is usually in the top 20 in college football rankings. Since the legendary Phil Flamm was hired as its head coach in 2006 (in hopes of reaching the elusive number 1 ranking), attendance at the five Saturday home games each year increased. Prior to Flamm’s arrival, attendance generally averaged 25,000 to 29,000 per game. Season ticket sales bumped up by 10,000 just with the announcement of the new coach’s arrival. Stephenville and SWU were ready to move to the big time!
The immediate issue facing SWU, however, was not NCAA ranking. It was capacity. The existing SWU stadium, built in 1953, has seating for 54,000 fans. The following table indicates attendance at each game for the past 6 years.
One of Flamm’s demands upon joining SWU had been a stadium expansion, or possibly even a new stadium. With attendance increasing, SWU administrators began to face the issue head-on. Flamm had wanted dormitories solely for his athletes in the stadium as an additional feature of any expansion.
SWU’s president, Dr. Joel Wisner, decided it was time for his vice president of development to
Southwestern University Football Game Attendance, 2007–2012
3. Discuss the school’s options.
Want to see the full answer?
Check out a sample textbook solution
Chapter 4 Solutions
Operations Management


- View the video Noodles & Company (8.28minutes, Ctrl + Click on the link); what are your key takeaways (tie to one or more of the topics discussed in Chapters 7 & 7S – service process design, type of job design, methods analysis, work methods, job design, learning curve effect, etc.) after watching this video. https://media.gaspar.mheducation.com/GASPARPlayer/play.html?id=E5i8OKgpqhwywhgFmpp1bmM Note: As a rough guideline, please try to keep the written submission to one or two paragraphs. 2) Leland, the job analyst at Zevo Toys, wanted to perform a time study on the assembling of toys. He observed one of the workers, Magorium, for five hours. During that time, Magorium assembled 250 toys. Leland rated Magorium as performing at 110 percent. The allowance for rest, personal time, etc. at Zevo Toys is 12 percent. a) Compute the normal time for the job. b) Compute the standard time for the job. Note: You could work out the problem by hand or use excel; in chapter 7,…arrow_forward1) Noodles & Company View the video Noodles & Company (8.28minutes, Ctrl + Click on the link); what are your key takeaways (tie to one or more of the topics discussed in Chapters 7 & 7S – service process design, type of job design, methods analysis, work methods, job design, learning curve effect, etc.) after watching this video. https://media.gaspar.mheducation.com/GASPARPlayer/play.html?id=E5i8OKgpqhwywhgFmpp1bmM Note: As a rough guideline, please try to keep the written submission to one or two paragraphs. 2) Leland, the job analyst at Zevo Toys, wanted to perform a time study on the assembling of toys. He observed one of the workers, Magorium, for five hours. During that time, Magorium assembled 250 toys. Leland rated Magorium as performing at 110 percent. The allowance for rest, personal time, etc. at Zevo Toys is 12 percent. a) Compute the normal time for the job. b) Compute the standard time for the job. Note: You could work out the problem by hand or use…arrow_forwardAn investigation of career development opportunities and job satisfaction atarrow_forward
- The Donald Fertilizer Company produces industrial chemical fertilizers. The projected manufacturing requirements (in gallons) for the next four quarters are 90,000, 90,000, 60,000, and 140,000 respectively. A level workforce is desired, relying only on anticipation inventory as a supply option. Stockouts and backorders are to be avoided, as are overtime and undertime. a. Determine the quarterly production rate required to meet total demand for the year, and minimize the anticipation inventory that would be left over at the end of the year. Beginning inventory is 0. The quarterly production rate is 95000 gallons. (Enter your response as an integer.) b. Specify the anticipation inventory that will be produced. (Enter your responses as an integers.) Quarter Anticipation inventory (gallons) 1 5000 2 10000 3 4 45000 c. Suppose that the requirements (in gallons) for the next four quarters are revised to 140,000, 60,000, 90,000, and 90,000 respectively. If total demand is the same, what level…arrow_forwardPlease help with the attached Capstone proposal Requirements:arrow_forwardLong term capacity plans and how to properly make decisions regarding long-term planning Long-term capacity plans cover periods longer periods of time. These plans are suitable for large businesses that want to scale their operations with a proven strategy for achieving production targets and meeting customer demands. Long-term capacity plans consider other factors apart from the productive requirements of the company. How important is it, in your mind, to properly make decisions regarding long-term capacity planning? How does this decision impact the present and future profitability of an organization? Be specific and give examples.arrow_forward
- In addition to the Amazon case study you provided, I'm curious if you've encountered other examples of companies successfully applying Little's Law to enhance their supply chain risk management practices. For instance, have you seen organizations use queuing theory to assess the potential ripple effects of disruptions, stress-test their contingency plans, or identify critical control points that require heightened monitoring and agility? Please provide a referencearrow_forwardSam's Pet Hotel operates 48 weeks per year, 6 days per week, and uses a continuous review inventory system. It purchases kitty litter for $13.00 per bag The following information is available about these bags: > Demand 85 bags/week >Order cost $60.00/order > Annual holding cost = 35 percent of cost > Desired cycle-service level 80 percent > Lead time = 4 weeks (24 working days) > Standard deviation of weekly demand = 15 bags > Current on-hand inventory is 320 bags, with no open orders or backorders. a. Suppose that the weekly demand forecast of 85 bags is incorrect and actual demand averages only 65 bags per week. How much higher will total costs be, owing to the distorted EOQ caused by this forecast error? The costs will be $higher owing to the error in EOQ. (Enter your response rounded to two decimal places.)arrow_forwardOsprey Sports stocks everything that a musky fisherman could want in the Great North Woods. A particular musky lure has been very popular with local fishermen as well as those who buy lures on the Internet from Osprey Sports. The cost to place orders with the supplier is $3030/order; the demand averages 55 lures per day, with a standard deviation of 11 lure; and the inventory holding cost is $1.001.00/lure/year. The lead time form the supplier is 1010 days, with a standard deviation of 33 days. It is important to maintain a 9898 percent cycle-service level to properly balance service with inventory holding costs. Osprey Sports is open 350 days a year to allow the owners the opportunity to fish for muskies during the prime season. The owners want to use a continuous review inventory system for this item. Refer to the standard normal table LOADING... for z-values. Part 2 a. What order quantity should be used? enter your response here lures. (Enter your response rounded to the…arrow_forward
- 9. Research Methodology Fully explain the Quantitative research methodology that and add in the following sub-sections: . Data Collection • Data Analysisarrow_forwardRuby-Star Incorporated is considering two different vendors for one of its top-selling products which has an average weekly demand of 40 units and is valued at $80 per unit. Inbound shipments from vendor 1 will average 340 units with an average lead time (including ordering delays and transit time) of 2 weeks. Inbound shipments from vendor 2 will average 550 units with an average lead time of 1 week. Ruby-Star operates 52 weeks per year; it carries a 2-week supply of inventory as safety stock and no anticipation inventory. a. The average aggregate inventory value of the product if Ruby-Star used vendor 1 exclusively is $ (Enter your response as a whole number.)arrow_forwardThe Carbondale Hospital is considering the purchase of a new ambulance. The decision will rest partly on the anticipated mileage to be driven next year. The miles driven during the past 5 years are as follows: Year Mileage 1 3,000 2 3 4 4,000 3,450 3,850 5 3,800 a) Using a 2-year moving average, the forecast for year 6 = miles (round your response to the nearest whole number). b) If a 2-year moving average is used to make the forecast, the MAD based on this = miles (round your response to one decimal place). (Hint: You will have only 3 years of matched data.) c) The forecast for year 6 using a weighted 2-year moving average with weights of 0.40 and 0.60 (the weight of 0.60 is for the most recent period) = ☐ miles (round your response to the nearest whole number). miles (round your response to one decimal place). (Hint: You will have only 3 years of The MAD for the forecast developed using a weighted 2-year moving average with weights of 0.40 and 0.60 = matched data.) d) Using…arrow_forward
 Purchasing and Supply Chain ManagementOperations ManagementISBN:9781285869681Author:Robert M. Monczka, Robert B. Handfield, Larry C. Giunipero, James L. PattersonPublisher:Cengage Learning
 MarketingMarketingISBN:9780357033791Author:Pride, William MPublisher:South Western Educational Publishing
 Practical Management ScienceOperations ManagementISBN:9781337406659Author:WINSTON, Wayne L.Publisher:Cengage,