INTRO. STATISTICAL QUALITY CONTROL
13th Edition
ISBN: 9781118909447
Author: Montgomery
Publisher: WILEY
expand_more
expand_more
format_list_bulleted
Concept explainers
Videos
Textbook Question
Chapter 4, Problem 37E
An article in the ACI Materials Journal (Vol. 84, 1987, pp. 213–216) describes several experiments investigating the rodding of concrete to remove entrapped air. A 3-in.-diameter cylinder was used, and the number of times this rod was used is the design variable. The resulting compressive strength of the concrete specimen is the response. The data are shown in Table 4E.5.
TABLE 4E.5
Compressive Strength Data for Exercise 4.37
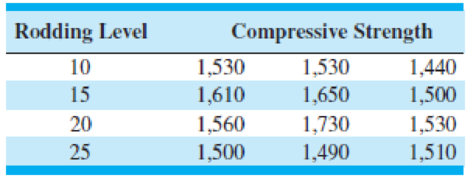
- (a) Is there any difference in compressive strength due to the rodding level? Answer this question by using the analysis of variance with α = 0.05.
- (b) Construct box plots of compressive strength by rodding level. Provide a practical interpretation of these plots.
- (c) Construct a normal
probability plot of the residuals from this experiment. Does the assumption of anormal distribution for compressive strength seem reasonable?
Expert Solution & Answer
Want to see the full answer?
Check out a sample textbook solution
Students have asked these similar questions
Consider an MA(6) model with θ1 = 0.5, θ2 = −25, θ3 = 0.125, θ4 = −0.0625,
θ5 = 0.03125, and θ6 = −0.015625. Find a much simpler model that has nearly the
same ψ-weights.
Let {Yt} be an AR(2) process of the special form Yt = φ2Yt − 2 + et. Use first principles
to find the range of values of φ2 for which the process is stationary.
Describe the important characteristics of the autocorrelation function for the following
models: (a) MA(1), (b) MA(2), (c) AR(1), (d) AR(2), and (e) ARMA(1,1).
Chapter 4 Solutions
INTRO. STATISTICAL QUALITY CONTROL
Ch. 4 - Suppose that you are testing the following...Ch. 4 - Suppose that you are testing the following...Ch. 4 - Suppose that you are testing the following...Ch. 4 - Suppose that you are testing the following...Ch. 4 - Suppose that you are testing the following...Ch. 4 - Suppose that you are testing the following...Ch. 4 - The inside diameters of bearings used in an...Ch. 4 - The tensile strength of a fiber used in...Ch. 4 - The service life of a battery used in a cardiac...Ch. 4 - Using the data from Exercise 4.7, construct a 95%...
Ch. 4 - A new process has been developed for applying...Ch. 4 - A machine is used to fill containers with a liquid...Ch. 4 - Ferric chloride is used as a flux in some types of...Ch. 4 - The diameters of aluminum alloy rods produced on...Ch. 4 - The output voltage of a power supply is assumed to...Ch. 4 - Two machines are used for filling glass bottles...Ch. 4 - Two quality control technicians measured the...Ch. 4 - Suppose that x1N(,12) and x2N(2,22), and that x1...Ch. 4 - Two different hardening processes(1) saltwater...Ch. 4 - A random sample of 200 printed circuit boards...Ch. 4 - A random sample of 500 connecting rod pins...Ch. 4 - Two processes are used to produce forgings used in...Ch. 4 - A new purification unit is installed in a chemical...Ch. 4 - Two different types of glass bottles are suitable...Ch. 4 - The diameter of a metal rod is measured by 12...Ch. 4 - The cooling system in a nuclear submarine consists...Ch. 4 - An experiment was conducted to investigate the...Ch. 4 - Suppose we wish to test the hypotheses H0:=15H1:15...Ch. 4 - Consider the hypotheses H0:=0H1:0 where 2 is...Ch. 4 - Sample size allocation. Suppose we are testing the...Ch. 4 - Develop a test for the hypotheses H0: 1 = 2 H1: 1 ...Ch. 4 - Nonconformities occur in glass bottles according...Ch. 4 - An inspector counts the surface-finish defects in...Ch. 4 - An in-line tester is used to evaluate the...Ch. 4 - An article in Solid State Technology (May 1987)...Ch. 4 - Compare the mean etch uniformity values at each of...Ch. 4 - An article in the ACI Materials Journal (Vol. 84,...Ch. 4 - Compare the mean compressive strength at each...Ch. 4 - An aluminum producer manufactures carbon anodes...Ch. 4 - Plot the residuals from Exercise 4.36 against the...Ch. 4 - An article in Environmental International (Vol....Ch. 4 - An article in the Journal of the Electrochemical...Ch. 4 - The tensile strength of a paper product is related...Ch. 4 - A plant distills liquid air to produce oxygen,...Ch. 4 - Plot the residuals from Exercise 4.43 and comment...Ch. 4 - Plot the residuals from Exercise 4.44 and comment...Ch. 4 - The brake horsepower developed by an automobile...Ch. 4 - Analyze the residuals from the regression model in...Ch. 4 - Table 4E.11 contains the data from a patient...Ch. 4 - Analyze the residuals from the regression model on...Ch. 4 - Reconsider the patient satisfaction data in Table...Ch. 4 - Analyze the residuals from the multiple regression...Ch. 4 - Consider the Minitab output below. (a) Fill in the...Ch. 4 - Suppose that you are testing H0: 1 = 2 versus H1: ...Ch. 4 - Suppose that you are testing H0: = 2 versus H1: ...Ch. 4 - Consider the Minitab output below. (a) Fill in the...Ch. 4 - Consider the Minitab output shown below. (a) Is...Ch. 4 - Consider the Minitab output shown below. (a) Fill...Ch. 4 - Consider the Minitab output below. (a) Fill in the...Ch. 4 - Consider a one-way or single-factor ANOVA with...Ch. 4 - Consider the Minitab ANOVA output below. Fill in...
Additional Math Textbook Solutions
Find more solutions based on key concepts
Drug for Nausea Ondansetron (Zofran) is a drug used by some pregnant women for nausea. There was some concern t...
Introductory Statistics
The following set of data is from sample of n=5: a. Compute the mean, median, and mode. b. Compute the range, v...
Basic Business Statistics, Student Value Edition
Use the table of integrals at the back of the text to evaluate the integrals in Exercises 1-26.
1.
University Calculus: Early Transcendentals (4th Edition)
Identify f as being linear, quadratic, or neither. If f is quadratic, identify the leading coefficient a and ...
College Algebra with Modeling & Visualization (5th Edition)
Version 2 of the Chain Rule Use Version 2 of the Chain Rule to calculate the derivatives of the following funct...
Calculus: Early Transcendentals (2nd Edition)
The 16 sequences in the sample space S.
Probability And Statistical Inference (10th Edition)
Knowledge Booster


Learn more about
Need a deep-dive on the concept behind this application? Look no further. Learn more about this topic, statistics and related others by exploring similar questions and additional content below.Similar questions
- « CENGAGE MINDTAP Quiz: Chapter 38 Assignment: Quiz: Chapter 38 ips Questions ra1kw08h_ch38.15m 13. 14. 15. O Which sentence has modifiers in the correct place? O a. When called, she for a medical emergency responds quickly. b. Without giving away too much of the plot, Helena described the heroine's actions in the film. O c. Nearly the snakebite victim died before the proper antitoxin was injected. . O O 16 16. O 17. 18. O 19. O 20 20. 21 21. 22. 22 DS 23. 23 24. 25. O O Oarrow_forwardQuestions ra1kw08h_ch36.14m 12. 13. 14. 15. 16. Ӧ 17. 18. 19. OS 20. Two separate sentences need Oa. two separate subjects. Ob. two dependent clauses. c. one shared subject.arrow_forwardCustomers experiencing technical difficulty with their Internet cable service may call an 800 number for technical support. It takes the technician between 30 seconds and 11 minutes to resolve the problem. The distribution of this support time follows the uniform distribution. Required: a. What are the values for a and b in minutes? Note: Do not round your intermediate calculations. Round your answers to 1 decimal place. b-1. What is the mean time to resolve the problem? b-2. What is the standard deviation of the time? c. What percent of the problems take more than 5 minutes to resolve? d. Suppose we wish to find the middle 50% of the problem-solving times. What are the end points of these two times?arrow_forward
- Exercise 6-6 (Algo) (LO6-3) The director of admissions at Kinzua University in Nova Scotia estimated the distribution of student admissions for the fall semester on the basis of past experience. Admissions Probability 1,100 0.5 1,400 0.4 1,300 0.1 Click here for the Excel Data File Required: What is the expected number of admissions for the fall semester? Compute the variance and the standard deviation of the number of admissions. Note: Round your standard deviation to 2 decimal places.arrow_forward1. Find the mean of the x-values (x-bar) and the mean of the y-values (y-bar) and write/label each here: 2. Label the second row in the table using proper notation; then, complete the table. In the fifth and sixth columns, show the 'products' of what you're multiplying, as well as the answers. X y x minus x-bar y minus y-bar (x minus x-bar)(y minus y-bar) (x minus x-bar)^2 xy 16 20 34 4-2 5 2 3. Write the sums that represents Sxx and Sxy in the table, at the bottom of their respective columns. 4. Find the slope of the Regression line: bi = (simplify your answer) 5. Find the y-intercept of the Regression line, and then write the equation of the Regression line. Show your work. Then, BOX your final answer. Express your line as "y-hat equals...arrow_forwardApply STATA commands & submit the output for each question only when indicated below i. Generate the log of birthweight and family income of children. Name these new variables Ibwght & Ifaminc. Include the output of this code. ii. Apply the command sum with the detail option to the variable faminc. Note: you should find the 25th percentile value, the 50th percentile and the 75th percentile value of faminc from the output - you will need it to answer the next question Include the output of this code. iii. iv. Use the output from part ii of this question to Generate a variable called "high_faminc" that takes a value 1 if faminc is less than or equal to the 25th percentile, it takes the value 2 if faminc is greater than 25th percentile but less than or equal to the 50th percentile, it takes the value 3 if faminc is greater than 50th percentile but less than or equal to the 75th percentile, it takes the value 4 if faminc is greater than the 75th percentile. Include the outcome of this code…arrow_forward
- solve this on paperarrow_forwardApply STATA commands & submit the output for each question only when indicated below i. Apply the command egen to create a variable called "wyd" which is the rowtotal function on variables bwght & faminc. ii. Apply the list command for the first 10 observations to show that the code in part i worked. Include the outcome of this code iii. Apply the egen command to create a new variable called "bwghtsum" using the sum function on variable bwght by the variable high_faminc (Note: need to apply the bysort' statement) iv. Apply the "by high_faminc" statement to find the V. descriptive statistics of bwght and bwghtsum Include the output of this code. Why is there a difference between the standard deviations of bwght and bwghtsum from part iv of this question?arrow_forwardAccording to a health information website, the distribution of adults’ diastolic blood pressure (in millimeters of mercury, mmHg) can be modeled by a normal distribution with mean 70 mmHg and standard deviation 20 mmHg. b. Above what diastolic pressure would classify someone in the highest 1% of blood pressures? Show all calculations used.arrow_forward
- Write STATA codes which will generate the outcomes in the questions & submit the output for each question only when indicated below i. ii. iii. iv. V. Write a code which will allow STATA to go to your favorite folder to access your files. Load the birthweight1.dta dataset from your favorite folder and save it under a different filename to protect data integrity. Call the new dataset babywt.dta (make sure to use the replace option). Verify that it contains 2,998 observations and 8 variables. Include the output of this code. Are there missing observations for variable(s) for the variables called bwght, faminc, cigs? How would you know? (You may use more than one code to show your answer(s)) Include the output of your code (s). Write the definitions of these variables: bwght, faminc, male, white, motheduc,cigs; which of these variables are categorical? [Hint: use the labels of the variables & the browse command] Who is this dataset about? Who can use this dataset to answer what kind of…arrow_forwardApply STATA commands & submit the output for each question only when indicated below İ. ii. iii. iv. V. Apply the command summarize on variables bwght and faminc. What is the average birthweight of babies and family income of the respondents? Include the output of this code. Apply the tab command on the variable called male. How many of the babies and what share of babies are male? Include the output of this code. Find the summary statistics (i.e. use the sum command) of the variables bwght and faminc if the babies are white. Include the output of this code. Find the summary statistics (i.e. use the sum command) of the variables bwght and faminc if the babies are male but not white. Include the output of this code. Using your answers to previous subparts of this question: What is the difference between the average birthweight of a baby who is male and a baby who is male but not white? What can you say anything about the difference in family income of the babies that are male and male…arrow_forwardA public health researcher is studying the impacts of nudge marketing techniques on shoppers vegetablesarrow_forward
arrow_back_ios
SEE MORE QUESTIONS
arrow_forward_ios
Recommended textbooks for you
 Glencoe Algebra 1, Student Edition, 9780079039897...AlgebraISBN:9780079039897Author:CarterPublisher:McGraw Hill
Glencoe Algebra 1, Student Edition, 9780079039897...
Algebra
ISBN:9780079039897
Author:Carter
Publisher:McGraw Hill
Correlation Vs Regression: Difference Between them with definition & Comparison Chart; Author: Key Differences;https://www.youtube.com/watch?v=Ou2QGSJVd0U;License: Standard YouTube License, CC-BY
Correlation and Regression: Concepts with Illustrative examples; Author: LEARN & APPLY : Lean and Six Sigma;https://www.youtube.com/watch?v=xTpHD5WLuoA;License: Standard YouTube License, CC-BY