INTRO. STATISTICAL QUALITY CONTROL
13th Edition
ISBN: 9781118909447
Author: Montgomery
Publisher: WILEY
expand_more
expand_more
format_list_bulleted
Concept explainers
Videos
Textbook Question
Chapter 4, Problem 51E
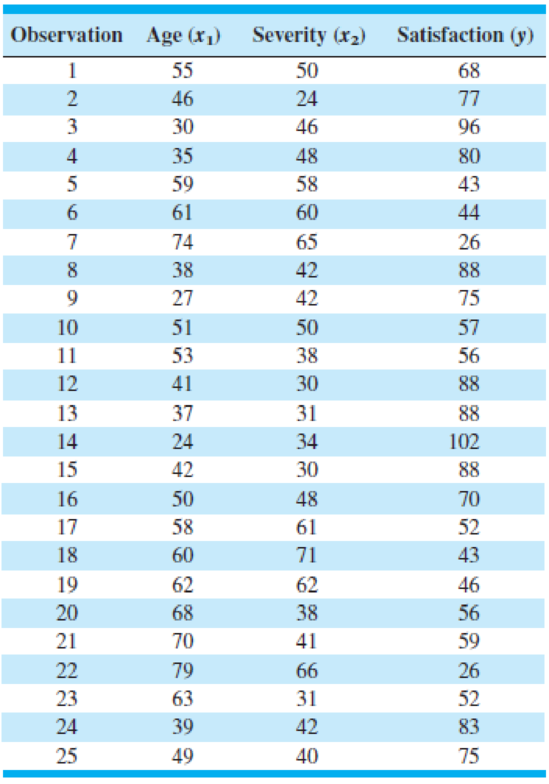
Reconsider the patient satisfaction data in Table 4E.11. Fit a multiple regression model using both patient age and severity as the regressors.
- (a) Test for significance of regression.
- (b) Test for the individual contribution of the two regressors. Are both regressor variables needed in the model?
- (c) Has adding severity to the model improved the quality of the model fit? Explain your answer.
TABLE 4E.11
Patient Satisfaction Data
Expert Solution & Answer
Want to see the full answer?
Check out a sample textbook solution
Students have asked these similar questions
To: [Boss's Name]
From: Nathaniel D Sain
Date: 4/5/2025
Subject: Decision Analysis for Business Scenario
Introduction to the Business Scenario
Our delivery services business has been experiencing steady growth, leading to an
increased demand for faster and more efficient deliveries. To meet this demand,
we must decide on the best strategy to expand our fleet. The three possible
alternatives under consideration are purchasing new delivery vehicles, leasing
vehicles, or partnering with third-party drivers. The decision must account for
various external factors, including fuel price fluctuations, demand stability, and
competition growth, which we categorize as the states of nature. Each alternative
presents unique advantages and challenges, and our goal is to select the most
viable option using a structured decision-making approach.
Alternatives and States of Nature
The three alternatives for fleet expansion were chosen based on their cost
implications, operational efficiency, and…
Business
Why researchers are interested in describing measures of the center and measures of variation of a data set?
Chapter 4 Solutions
INTRO. STATISTICAL QUALITY CONTROL
Ch. 4 - Suppose that you are testing the following...Ch. 4 - Suppose that you are testing the following...Ch. 4 - Suppose that you are testing the following...Ch. 4 - Suppose that you are testing the following...Ch. 4 - Suppose that you are testing the following...Ch. 4 - Suppose that you are testing the following...Ch. 4 - The inside diameters of bearings used in an...Ch. 4 - The tensile strength of a fiber used in...Ch. 4 - The service life of a battery used in a cardiac...Ch. 4 - Using the data from Exercise 4.7, construct a 95%...
Ch. 4 - A new process has been developed for applying...Ch. 4 - A machine is used to fill containers with a liquid...Ch. 4 - Ferric chloride is used as a flux in some types of...Ch. 4 - The diameters of aluminum alloy rods produced on...Ch. 4 - The output voltage of a power supply is assumed to...Ch. 4 - Two machines are used for filling glass bottles...Ch. 4 - Two quality control technicians measured the...Ch. 4 - Suppose that x1N(,12) and x2N(2,22), and that x1...Ch. 4 - Two different hardening processes(1) saltwater...Ch. 4 - A random sample of 200 printed circuit boards...Ch. 4 - A random sample of 500 connecting rod pins...Ch. 4 - Two processes are used to produce forgings used in...Ch. 4 - A new purification unit is installed in a chemical...Ch. 4 - Two different types of glass bottles are suitable...Ch. 4 - The diameter of a metal rod is measured by 12...Ch. 4 - The cooling system in a nuclear submarine consists...Ch. 4 - An experiment was conducted to investigate the...Ch. 4 - Suppose we wish to test the hypotheses H0:=15H1:15...Ch. 4 - Consider the hypotheses H0:=0H1:0 where 2 is...Ch. 4 - Sample size allocation. Suppose we are testing the...Ch. 4 - Develop a test for the hypotheses H0: 1 = 2 H1: 1 ...Ch. 4 - Nonconformities occur in glass bottles according...Ch. 4 - An inspector counts the surface-finish defects in...Ch. 4 - An in-line tester is used to evaluate the...Ch. 4 - An article in Solid State Technology (May 1987)...Ch. 4 - Compare the mean etch uniformity values at each of...Ch. 4 - An article in the ACI Materials Journal (Vol. 84,...Ch. 4 - Compare the mean compressive strength at each...Ch. 4 - An aluminum producer manufactures carbon anodes...Ch. 4 - Plot the residuals from Exercise 4.36 against the...Ch. 4 - An article in Environmental International (Vol....Ch. 4 - An article in the Journal of the Electrochemical...Ch. 4 - The tensile strength of a paper product is related...Ch. 4 - A plant distills liquid air to produce oxygen,...Ch. 4 - Plot the residuals from Exercise 4.43 and comment...Ch. 4 - Plot the residuals from Exercise 4.44 and comment...Ch. 4 - The brake horsepower developed by an automobile...Ch. 4 - Analyze the residuals from the regression model in...Ch. 4 - Table 4E.11 contains the data from a patient...Ch. 4 - Analyze the residuals from the regression model on...Ch. 4 - Reconsider the patient satisfaction data in Table...Ch. 4 - Analyze the residuals from the multiple regression...Ch. 4 - Consider the Minitab output below. (a) Fill in the...Ch. 4 - Suppose that you are testing H0: 1 = 2 versus H1: ...Ch. 4 - Suppose that you are testing H0: = 2 versus H1: ...Ch. 4 - Consider the Minitab output below. (a) Fill in the...Ch. 4 - Consider the Minitab output shown below. (a) Is...Ch. 4 - Consider the Minitab output shown below. (a) Fill...Ch. 4 - Consider the Minitab output below. (a) Fill in the...Ch. 4 - Consider a one-way or single-factor ANOVA with...Ch. 4 - Consider the Minitab ANOVA output below. Fill in...
Additional Math Textbook Solutions
Find more solutions based on key concepts
In Exercises 11-20, express each decimal as a percent.
11. 0.59
Thinking Mathematically (6th Edition)
For a population containing N=902 individual, what code number would you assign for a. the first person on the ...
Basic Business Statistics, Student Value Edition
1. How many solutions are there to ax + b = 0 with ?
College Algebra with Modeling & Visualization (5th Edition)
Assessment 1-1A Cookies are sold singly or in packages of 2 or 6. With this packaging, how many ways can you bu...
A Problem Solving Approach To Mathematics For Elementary School Teachers (13th Edition)
Standard Normal Distribution. In Exercises 17–36, assume that a randomly selected subject is given a bone densi...
Elementary Statistics (13th Edition)
Knowledge Booster


Learn more about
Need a deep-dive on the concept behind this application? Look no further. Learn more about this topic, statistics and related others by exploring similar questions and additional content below.Similar questions
- WHAT IS THE SOLUTION?arrow_forwardThe following ordered data list shows the data speeds for cell phones used by a telephone company at an airport: A. Calculate the Measures of Central Tendency from the ungrouped data list. B. Group the data in an appropriate frequency table. C. Calculate the Measures of Central Tendency using the table in point B. 0.8 1.4 1.8 1.9 3.2 3.6 4.5 4.5 4.6 6.2 6.5 7.7 7.9 9.9 10.2 10.3 10.9 11.1 11.1 11.6 11.8 12.0 13.1 13.5 13.7 14.1 14.2 14.7 15.0 15.1 15.5 15.8 16.0 17.5 18.2 20.2 21.1 21.5 22.2 22.4 23.1 24.5 25.7 28.5 34.6 38.5 43.0 55.6 71.3 77.8arrow_forwardII Consider the following data matrix X: X1 X2 0.5 0.4 0.2 0.5 0.5 0.5 10.3 10 10.1 10.4 10.1 10.5 What will the resulting clusters be when using the k-Means method with k = 2. In your own words, explain why this result is indeed expected, i.e. why this clustering minimises the ESS map.arrow_forward
- why the answer is 3 and 10?arrow_forwardPS 9 Two films are shown on screen A and screen B at a cinema each evening. The numbers of people viewing the films on 12 consecutive evenings are shown in the back-to-back stem-and-leaf diagram. Screen A (12) Screen B (12) 8 037 34 7 6 4 0 534 74 1645678 92 71689 Key: 116|4 represents 61 viewers for A and 64 viewers for B A second stem-and-leaf diagram (with rows of the same width as the previous diagram) is drawn showing the total number of people viewing films at the cinema on each of these 12 evenings. Find the least and greatest possible number of rows that this second diagram could have. TIP On the evening when 30 people viewed films on screen A, there could have been as few as 37 or as many as 79 people viewing films on screen B.arrow_forwardQ.2.4 There are twelve (12) teams participating in a pub quiz. What is the probability of correctly predicting the top three teams at the end of the competition, in the correct order? Give your final answer as a fraction in its simplest form.arrow_forward
- The table below indicates the number of years of experience of a sample of employees who work on a particular production line and the corresponding number of units of a good that each employee produced last month. Years of Experience (x) Number of Goods (y) 11 63 5 57 1 48 4 54 5 45 3 51 Q.1.1 By completing the table below and then applying the relevant formulae, determine the line of best fit for this bivariate data set. Do NOT change the units for the variables. X y X2 xy Ex= Ey= EX2 EXY= Q.1.2 Estimate the number of units of the good that would have been produced last month by an employee with 8 years of experience. Q.1.3 Using your calculator, determine the coefficient of correlation for the data set. Interpret your answer. Q.1.4 Compute the coefficient of determination for the data set. Interpret your answer.arrow_forwardCan you answer this question for mearrow_forwardTechniques QUAT6221 2025 PT B... TM Tabudi Maphoru Activities Assessments Class Progress lIE Library • Help v The table below shows the prices (R) and quantities (kg) of rice, meat and potatoes items bought during 2013 and 2014: 2013 2014 P1Qo PoQo Q1Po P1Q1 Price Ро Quantity Qo Price P1 Quantity Q1 Rice 7 80 6 70 480 560 490 420 Meat 30 50 35 60 1 750 1 500 1 800 2 100 Potatoes 3 100 3 100 300 300 300 300 TOTAL 40 230 44 230 2 530 2 360 2 590 2 820 Instructions: 1 Corall dawn to tha bottom of thir ceraan urina se se tha haca nariad in archerca antarand cubmit Q Search ENG US 口X 2025/05arrow_forward
- The table below indicates the number of years of experience of a sample of employees who work on a particular production line and the corresponding number of units of a good that each employee produced last month. Years of Experience (x) Number of Goods (y) 11 63 5 57 1 48 4 54 45 3 51 Q.1.1 By completing the table below and then applying the relevant formulae, determine the line of best fit for this bivariate data set. Do NOT change the units for the variables. X y X2 xy Ex= Ey= EX2 EXY= Q.1.2 Estimate the number of units of the good that would have been produced last month by an employee with 8 years of experience. Q.1.3 Using your calculator, determine the coefficient of correlation for the data set. Interpret your answer. Q.1.4 Compute the coefficient of determination for the data set. Interpret your answer.arrow_forwardQ.3.2 A sample of consumers was asked to name their favourite fruit. The results regarding the popularity of the different fruits are given in the following table. Type of Fruit Number of Consumers Banana 25 Apple 20 Orange 5 TOTAL 50 Draw a bar chart to graphically illustrate the results given in the table.arrow_forwardQ.2.3 The probability that a randomly selected employee of Company Z is female is 0.75. The probability that an employee of the same company works in the Production department, given that the employee is female, is 0.25. What is the probability that a randomly selected employee of the company will be female and will work in the Production department? Q.2.4 There are twelve (12) teams participating in a pub quiz. What is the probability of correctly predicting the top three teams at the end of the competition, in the correct order? Give your final answer as a fraction in its simplest form.arrow_forward
arrow_back_ios
SEE MORE QUESTIONS
arrow_forward_ios
Recommended textbooks for you
 Glencoe Algebra 1, Student Edition, 9780079039897...AlgebraISBN:9780079039897Author:CarterPublisher:McGraw Hill
 Functions and Change: A Modeling Approach to Coll...AlgebraISBN:9781337111348Author:Bruce Crauder, Benny Evans, Alan NoellPublisher:Cengage Learning
 Big Ideas Math A Bridge To Success Algebra 1: Stu...AlgebraISBN:9781680331141Author:HOUGHTON MIFFLIN HARCOURTPublisher:Houghton Mifflin Harcourt
 College AlgebraAlgebraISBN:9781305115545Author:James Stewart, Lothar Redlin, Saleem WatsonPublisher:Cengage Learning
Glencoe Algebra 1, Student Edition, 9780079039897...
Algebra
ISBN:9780079039897
Author:Carter
Publisher:McGraw Hill
Functions and Change: A Modeling Approach to Coll...
Algebra
ISBN:9781337111348
Author:Bruce Crauder, Benny Evans, Alan Noell
Publisher:Cengage Learning
Big Ideas Math A Bridge To Success Algebra 1: Stu...
Algebra
ISBN:9781680331141
Author:HOUGHTON MIFFLIN HARCOURT
Publisher:Houghton Mifflin Harcourt
College Algebra
Algebra
ISBN:9781305115545
Author:James Stewart, Lothar Redlin, Saleem Watson
Publisher:Cengage Learning
Correlation Vs Regression: Difference Between them with definition & Comparison Chart; Author: Key Differences;https://www.youtube.com/watch?v=Ou2QGSJVd0U;License: Standard YouTube License, CC-BY
Correlation and Regression: Concepts with Illustrative examples; Author: LEARN & APPLY : Lean and Six Sigma;https://www.youtube.com/watch?v=xTpHD5WLuoA;License: Standard YouTube License, CC-BY