
Concept explainers
Videos
Video Case
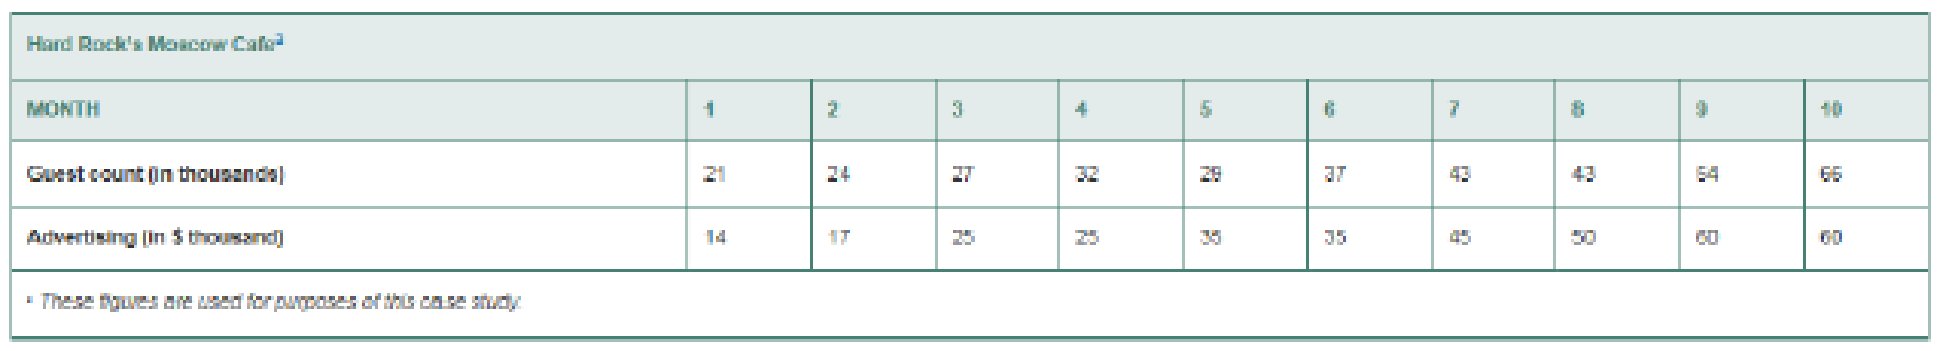
With the growth of Hard Rock Cafe—from one pub in London in 1971 to more than 150 restaurants in 53 countries today—came a corporatewide demand for better forecasting. Hard Rock uses long-range forecasting in setting a capacity plan and intermediate-term forecasting for locking in contracts for leather goods (used in jackets) and for such food items as beef, chicken, and pork Its short-term sales forecasts are conducted each month, by cafe, and then aggregated for a headquarters view.
The heart of the sales forecasting system is the point-of-sale (POS) system, which, in effect, captures transaction data on nearly every person who walks through a cafe’s door. The sale of each entrée represents one customer; the entrée sales data are transmitted daily to the Orlando corporate headquarters’ database. There, the financial team, headed by Todd Lindsey, begins the forecast process. Lindsey forecasts monthly guest counts, retail sales, banquet sales, and concert sales (if applicable) at each cafe. The general managers of individual cafes tap into the same database to prepare a daily forecast for their sites. A cafe manager pulls up prior years’ sales for that day, adding information from the local Chamber of Commerce or Tourist Board on upcoming events such as a major convention, sporting event, or concert in the city where the cafe is located. The daily forecast is further broken into hourly sales, which drives employee
Hard Rock doesn’t limit its use of forecasting tools to sales. To evaluate managers and set bonuses, a 3-year weighted moving average is applied to cafe sales. If cafe general managers exceed their targets, a bonus is computed. Todd Lindsey, at corporate headquarters, applies weights of 40% to the most recent year’s sales, 40% to the year before, and 20% to sales 2 years ago in reaching his moving average.
An even more sophisticated application of statistics is found in Hard Rock’s menu planning. Using multiple regression, managers can compute the impact on demand of other menu items if the price of one item is changed. For example, if the price of a cheeseburger increases from $7.99 to $8.99, Hard Rock can predict the effect this will have on sales of chicken sandwiches, pork sandwiches, and salads. Managers do the same analysis on menu placement, with the center section driving higher sales volumes. When an item such as a hamburger is moved off the center to one of the side flaps, the corresponding effect on related items, say trench fries, is determined.
2. What is the role of the POS system in forecasting at Hard Rock?
Want to see the full answer?
Check out a sample textbook solution
Chapter 4 Solutions
Operations Management: Sustainability and Supply Chain Management Plus MyLab Operations Management with Pearson eText -- Access Card Package (12th Edition)


- Prepare a master schedule given this information: The forecast for each week of an eight-week schedule is 60 units. The MPS rule is to schedule production if the projected on-hand Inventory would be negative without it. Customer orders (committed) are as follows: Week Customer Orders 1 2 36 28 4 1 Use a production lot size of 85 units and no beginning inventory. Note: In the ATP row, enter a value of 0 (zero) in any periods where ATP should not be calculated. Leave no cells blank - be certain to enter "0" wherever required. June July 1 2 3 4 5 8 7 8 Forecast 60 60 60 60 60 60 60 60 Customer Orders 38 28 4 1 0 0 0 0 Projected On-Hand Inventory MPS ATParrow_forwardSales of tablet computers at Marika Gonzalez's electronics store in Washington, D.C., over the past 10 weeks are shown in the table below: Week 1 2 3 4 5 6 7 8 9 10 Demand 21 21 27 38 25 30 35 24 25 30 a) The forecast for weeks 2 through 10 using exponential smoothing with a = 0.50 and a week 1 initial forecast of 21.0 are (round your responses to two decimal places): Week 1 2 3 4 5 6 7 8 9 10 Demand 21 21 27 38 25 30 35 24 25 30 Forecast 21.0 21 21 24 31 28 29 32 28 26.50 b) For the forecast developed using exponential smoothing (a = 0.50 and initial forecast 21.0), the MAD = |||||sales (round your response to two decimal places).arrow_forwardSales of tablet computers at Marika Gonzalez's electronics store in Washington, D.C., over the past 10 weeks are shown in the table below: Week Demand 1 2 3 4 5 6 7 8 9 10 21 21 27 38 25 30 35 24 25 30 a) The forecast for weeks 2 through 10 using exponential smoothing with a = 0.50 and a week 1 initial forecast of 21.0 are (round your responses to two decimal places): Week 1 2 3 4 5 Demand 21 21 27 38 Forecast 21.0 ☐ G ☐ ☐ 6 7 25 30 35 ∞ ☐ 8 9 10 24 25 30arrow_forward
- Each machine costs $3 Million. Building the room with all its attendant safety protection and other ancillary costs increases the spending by an additional $2.0 million dollars per MRI suite. Each machine can perform 2000 scans per year. Each reading of an MRI scan by a radiologist, along with other per-scan-related costs, is $500 per scan. The machine will last five years. Don’t worry about discount rates for this problem Graph the total costs over 5 years as a function of sales for 0-3000 patients annually. Hint: you may need to add a second MRI at some point. Suppose that you want to make a profit of $500 per scan at a target volume of 1000 patients per year, and you purchase only one machine. Superimpose the total revenue curve on top of the total cost curve in (1).arrow_forwardI need the answer to requirement C.arrow_forwardImagine you are Susan Kim and are faced with a difficult choice to either follow the orders she was given, or refusing to do so. Using each lens determine what the ethical response would be. Suppot your answer with materials from readings and lectures. For example, using Universalism what would the ethical response be? Do the same for all four lenses.arrow_forward
- Answer all these questions, selecting any company of your choice. Choose a specific type of food company. Select a specific product. Develop all the inputs that are part of the process. Develop the transformation process in a graphic (diagram, etc.). Develop all the outputs or finished products that are part of the process. Describe all the processes involved in one line of production in any manufacturing facility. Also describing how good management is the center of any part of a production company.arrow_forwardUsing exponential smoothing with α =0.2, forecast the demand for The initial forecast for January is 2000 tons. Calculate the capacity utilization for June, July and Discuss the implications of underutilized or over utilized capacity for Green Harvestarrow_forwardIn organizational development when results are improving but relationships are declining, what leadership style is appropriate? directing delegating supporting coachingarrow_forward
- What is the first thing a leader should do when moving through a cultural change? conduct an assessment comparing the practices to other high-performing organizations learn about the current organizational culture continue to monitor key metrics define expectationsarrow_forwardThe third change leadership strategy, Collaborate on Implementation, is designed to address what type of concerns? impact concerns personal concerns refinement concerns collaboration concernsarrow_forwardIf team members are concerned with specifics such as their tasks, contingency plans, resources, and timeline, what concerns do they have? implementation concerns impact concerns refinement concerns personal concernsarrow_forward
 MarketingMarketingISBN:9780357033791Author:Pride, William MPublisher:South Western Educational Publishing
 Contemporary MarketingMarketingISBN:9780357033777Author:Louis E. Boone, David L. KurtzPublisher:Cengage Learning
 Purchasing and Supply Chain ManagementOperations ManagementISBN:9781285869681Author:Robert M. Monczka, Robert B. Handfield, Larry C. Giunipero, James L. PattersonPublisher:Cengage Learning
 Practical Management ScienceOperations ManagementISBN:9781337406659Author:WINSTON, Wayne L.Publisher:Cengage,