
Concept explainers
(a):
The equilibrium
(a):
Explanation of Solution
The equilibrium demand and supply of milk in the economy can be obtained at the point of intersection of the market demand and supply curves in the economy. The market demand and supply schedules are given, and a graph can be plotted on the basis of the schedule as follows:
|
Quantity demanded (millions of gallons) |
Quantity supplied (millions of gallons) | |
| $10.00 | 100 | 500 |
| 8.00 | 200 | 400 |
| 6.00 | 300 | 300 |
| 4.00 | 400 | 200 |
| 2.00 | 500 | 100 |
Based on this table, it is identified that the quantity supplied increases as price increases and there is a direct and positive relation between the price and quantity supplied. On the other hand, there is a negative relation between the quantity demanded and price because the quantity demanded decreases as price increases. Thus, the quantity demanded will be indicated by a downward sloping curve, whereas the quantity supplied will be indicated by an upward sloping curve as follows:
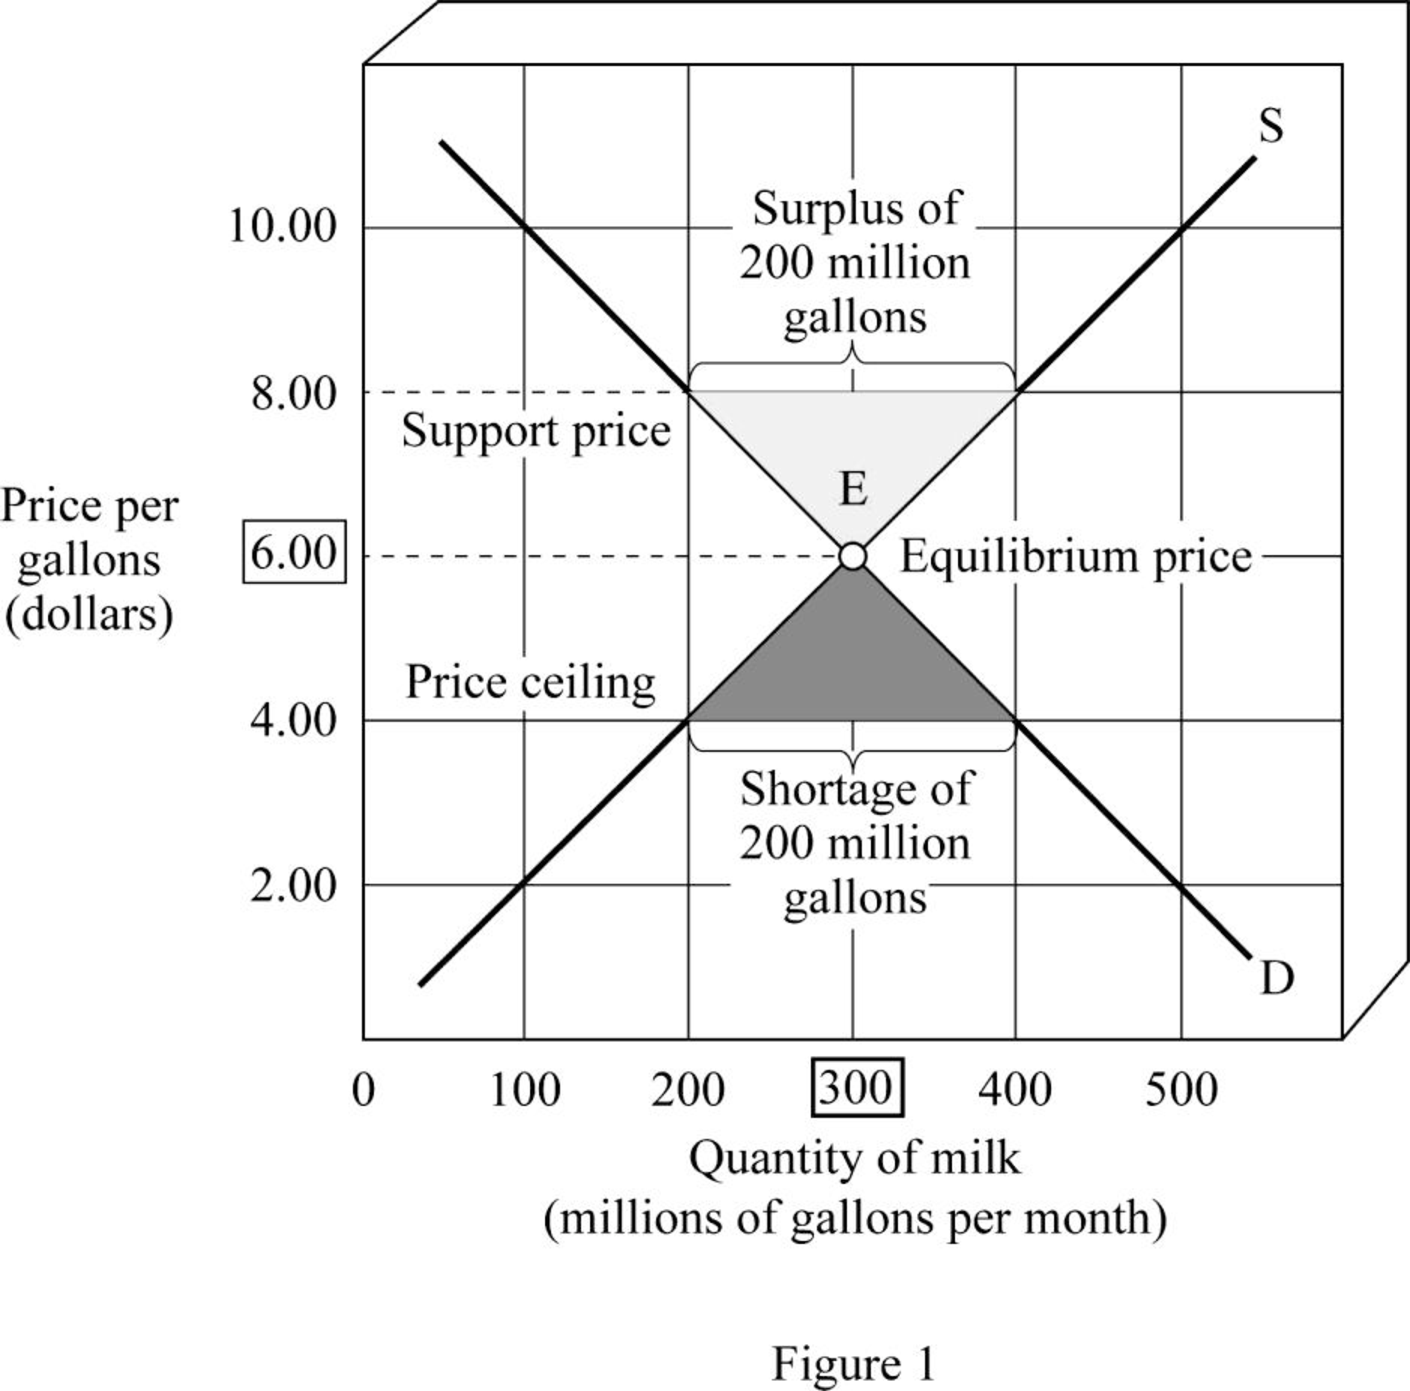
From the diagram, it is observed that the market demand for milk and the supply of milk intersect at Point E. The corresponding quantity at Point E will be the
Equilibrium: Equilibrium in the market is obtained at the point where the market demand is equal to the market supply, and there is no excess demand or supply present in the economy.
(b):
The effect of support price of $8 per gallon of milk.
(b):
Explanation of Solution
From the diagram, it is observed that the market demand for milk and the supply of milk intersect at Point E. The corresponding quantity Point E will be the equilibrium quantity of milk and the corresponding price Point E will be the equilibrium price of the milk. Thus, at the point of equilibrium E, the equilibrium price is $6 per gallon and the quantity is 300 gallons per month.
However, when the government enacts the support price of $8 per gallon, the market price will be $8 per gallon. The quantity demanded at this price is 200 gallons per month, whereas the quantity supplied is 400 gallons per month. This means that there will be a surplus of 200 gallons of milk in the economy. The government has to purchase this excess surplus from the market. Since the government revenue is the tax revenue, the non–milk-drinking taxpayers have to pay for the milk indirectly.
(c):
The effect of ceiling price of $4 per gallon of milk.
(c):
Explanation of Solution
When the government enacts the ceiling price of $4 per gallon, the market price will be $4 per gallon. The quantity demanded at this price is 400 gallons per month, whereas the quantity supplied is 200 gallons per month. This means that there will be a shortage of 200 gallons of milk in the economy. The government has to ration the milk in order to prevent the black marketing of milk. This is caused due to the action of the government to keep the price of milk below the equilibrium level of $6 per gallon.
Want to see more full solutions like this?
Chapter 4 Solutions
Survey of Economics (MindTap Course List)


- Gordon Dividend Growth Model I downloaded some data about 3M (ticker MMM). Company 3M Ticker MMM Dividends Per Share 2017 $4.70 2018 $5.44 2019 $5.76 2020 $5.88 2021 $5.92 2022 $5.96 4. The dividend payment in 2022 was $5.96 per share. Based on the five-year history, we see that dividends per share grew at a compound annual growth rate of 4.86% $5.96 (1/5) CAGR = $4.70 − 1 = (1.2681)0.20 − 1 = 1.0486 - 1 = 0.0486 = 4.86% - - What should be the 2023 dividend based on these values?arrow_forward4. The data set BWGHT.DTA contains data on births to women in the United States. Two variables of interest are the dependent variable, infant birth weight in ounces (bwght), and an explanatory variable, average number of cigarettes the mother smoked per day during pregnancy (cigs). The following simple regression was estimated using data on n=1,388 births: bwght=119.77 - .514 cigs (i) What is the predicted birth weight when cigs = 0? What about when cigs=20 (one pack per day)? Comment on the difference. (ii) Does this simple regression necessarily capture a causal relationship between the child's birth weight and the mother's smoking habits? Explain. (iii) To predict a birth weight of 125 ounces, what would cigs have to be? Comment. (iv) The proportion of women in the sample who do not smoke while pregnant is about .85. Does this help reconcile your finding from part (iii)?arrow_forwardGiven the demand equation Q following table (using Excel): = 1,500 200P, calculate all the numbers necessary to fill in the Elasticity P Q Point Arc Total Revenue Revenue Marginal $7.00 6.50 6.00 5.50 5.00 4.50 4.00 3.50 3.00 2.50arrow_forward
- Suppose a firm has the following demand equation: where Q = quantity demanded P = product price (in dollars) Q=1,000 3,000P + 10A A = advertising expenditure (in dollars) Assume for the following questions that P =3$ and A = $2,000. 1. Suppose the firm dropped the price to $2.50. Would this be beneficial? Explain. Illustrate your answer with the use of a demand schedule and demand curve. 2. Suppose the firm raised the price to $4.00 while increasing its advertising expenditure by $100. Would this be beneficial? Explain. Illustrate your answer with the use of a demand schedule and a demand curve. (Hint: First construct the schedule and the curve assuming A = $2,000. Then construct the new schedule and curve assuming A = $2,100.)arrow_forwardABC Sports, a store that sells various types of sports clothing and other sports items, is planning to introduce a new design of Arizona Diamondbacks' baseball caps. A consultant has estimated the demand curve to be where Q is cap sales and P is price. Q=2,000 100P 1. How many caps could ABC sell at $6 each? 2. How much would the price have to be to sell 1,800 caps? 3. Suppose ABC were to use the caps as a promotion. How many caps could ABC give away free? 4. At what price would no caps be sold? 5. Calculate the point price elasticity of demand at a price of $6.arrow_forward1. What are the basic information related to the BPO industry in the Philippines? 2. Top 15 BPO industries here in the Philippines. 3. Significance to certain economies. 4. What services are being outsourced?arrow_forward
- Select a real-world case situation relevant to credit analysis and lending in Guyana. Use this case which you either know about already or have identified through research and address the following questions in essay format: i. Outline and discuss what “triggered” the regulatory body to intervene? ii. How effective do you think the response was to such a crisis? iii. Outline and discuss two ways that could be used to strengthen the current regulatory environment?arrow_forwardHome can produce a maximum of 400 apples or a maximum of 600 bananas.Foreign can produce a maximum of 160 apples or a maximum of 800 bananas.(a) Graph and label Homes PPF. Label each axis and the slope. Use numbers.1(b) In the absence of trade, what is Homes autarky price of apples in terms of bananas?(c) Graph and label Foreigns production possibility frontier. Use numbers and label the slope.(d) Graph the world relative supply curve. Use numbers.23. (8 pts - RM) Now suppose world relative demand for apples takes the following form:Demand for apples/demand for bananas - price of bananas/price of apples. That is, RDA = Pbananas Papples(a) Graph the relative demand and relative supply curves on the world market diagram. Use numbers(b) What is the equilibrium (world) relative price of apples? (c) Show that both Home and Foreign gain from Trade and describe the pattern of trade.arrow_forwardA village has six residents, each of whom has accumulated savings of $100. Each villager can use this money either to buy a government bond that pays 18 percent interest per year or to buy a year-old llama, send it onto the commons to graze, and sell it after 1 year. The price the villager gets for the 2-year-old llama depends on the quality of the fleece It grows while grazing on the commons. That in turn depends on the animal's access to grazing, which depends on the number of llamas sent to the commons, as shown in the following table: Number of 11amas on the commons Price per 2- year-old 11ama ($) 1 125 2 119 3 116 4 113 5 6 111 109 The villagers make their investment decisions one after another, and their decisions are public. a. If each villager decides Individually how to Invest, how many llamas will be sent onto the commons, and what will be the resulting village Income? Number of llamas: [ 20 Instructions: Enter your response as a whole number. Village Income: $ 110 b. What is…arrow_forward
- 5. Discrimination in the labor market The following table exhibits the name, gender, height, and minimum wage 10 people are willing to accept to work as travel nurses at a regional hospital. Name Gender Height Minimum Wage (Inches) (Dollars per week) Cho F 65 $297 Frances F 64 $316 Latasha F 68 $336 Dmitri M 70 $355 Jake M 71 $374 Rosa F 65 $393 Nick M 72 $420 Brian M 71 $439 Tim M 66 $451 Alyssa F 68 $478 The lowest weekly wage that the hospital can spend in order to hire five travel nurses is ________. Suppose the hiring director of the hospital prefers taller candidates because they think it will increase revenue, and so they impose a requirement that all newly hired travel nurses must have a height of at least 68 inches. With this mandate in place, the weekly wage rate the hospital now must pay in order to hire five travel nurses increases by ________.arrow_forward5. Discrimination in the labor market The following table exhibits the name, gender, height, and minimum wage 10 people are willing to accept to work as human resource specialists at a large financial firm. Name Gender Height Minimum Wage (Inches) (Dollars per week) Paolo M 67 $298 Ginny F 63 $311 Lucia F 66 $332 Eric M 71 $354 Kenji M 69 $375 Sharon F 66 $397 Paolo M 70 $411 Carlos M 70 $440 Van M 64 $452 Amy F 69 $474 The lowest weekly wage that the financial firm can spend in order to hire five human resource specialists is____. Suppose the hiring director of the financial firm prefers taller candidates because they think it will increase revenue, and so they impose a requirement that all newly hired human resource specialists must have a height of at least 67 inches. With this mandate in place, the weekly wage rate the financial firm now must pay in order to hire five human resource specialists increases by_____.arrow_forwardnot use ai pleasearrow_forward


 Economics (MindTap Course List)EconomicsISBN:9781337617383Author:Roger A. ArnoldPublisher:Cengage Learning

 Exploring EconomicsEconomicsISBN:9781544336329Author:Robert L. SextonPublisher:SAGE Publications, Inc