
Concept explainers
(a):
The equilibrium
(a):
Explanation of Solution
The equilibrium demand and supply of milk in the economy can be obtained at the point of intersection of the market demand and supply curves in the economy. The market demand and supply schedules are given, and a graph can be plotted on the basis of the schedule as follows:
|
Quantity demanded (millions of gallons) |
Quantity supplied (millions of gallons) | |
| $10.00 | 100 | 500 |
| 8.00 | 200 | 400 |
| 6.00 | 300 | 300 |
| 4.00 | 400 | 200 |
| 2.00 | 500 | 100 |
Based on this table, it is identified that the quantity supplied increases as price increases and there is a direct and positive relation between the price and quantity supplied. On the other hand, there is a negative relation between the quantity demanded and price because the quantity demanded decreases as price increases. Thus, the quantity demanded will be indicated by a downward sloping curve, whereas the quantity supplied will be indicated by an upward sloping curve as follows:
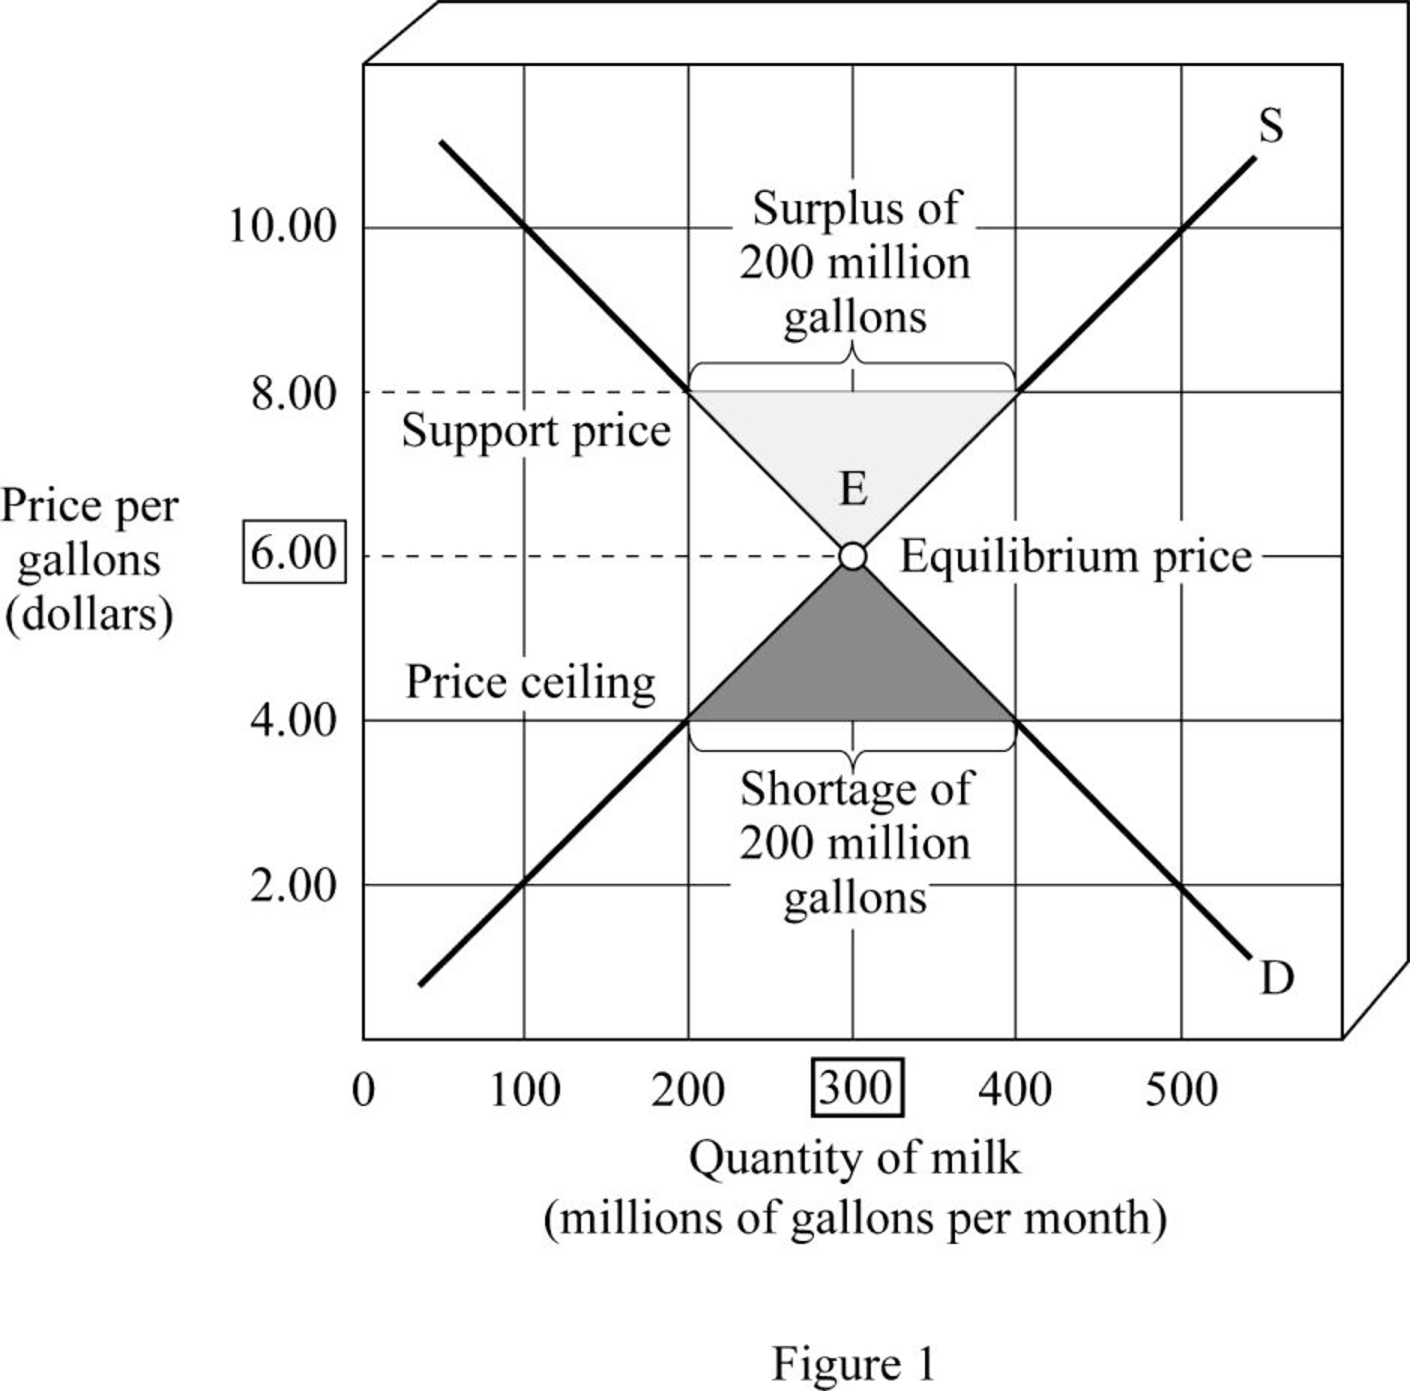
From the diagram, it is observed that the market demand for milk and the supply of milk intersect at Point E. The corresponding quantity at Point E will be the
Equilibrium: Equilibrium in the market is obtained at the point where the market demand is equal to the market supply, and there is no excess demand or supply present in the economy.
(b):
The effect of support price of $8 per gallon of milk.
(b):
Explanation of Solution
From the diagram, it is observed that the market demand for milk and the supply of milk intersect at Point E. The corresponding quantity Point E will be the equilibrium quantity of milk and the corresponding price Point E will be the equilibrium price of the milk. Thus, at the point of equilibrium E, the equilibrium price is $6 per gallon and the quantity is 300 gallons per month.
However, when the government enacts the support price of $8 per gallon, the market price will be $8 per gallon. The quantity demanded at this price is 200 gallons per month, whereas the quantity supplied is 400 gallons per month. This means that there will be a surplus of 200 gallons of milk in the economy. The government has to purchase this excess surplus from the market. Since the government revenue is the tax revenue, the non–milk-drinking taxpayers have to pay for the milk indirectly.
(c):
The effect of ceiling price of $4 per gallon of milk.
(c):
Explanation of Solution
When the government enacts the ceiling price of $4 per gallon, the market price will be $4 per gallon. The quantity demanded at this price is 400 gallons per month, whereas the quantity supplied is 200 gallons per month. This means that there will be a shortage of 200 gallons of milk in the economy. The government has to ration the milk in order to prevent the black marketing of milk. This is caused due to the action of the government to keep the price of milk below the equilibrium level of $6 per gallon.
Want to see more full solutions like this?
Chapter 4 Solutions
MACROECONOMICS FOR TODAY-W/LMS MINDTAP


- 5. Discrimination in the labor market The following table exhibits the name, gender, height, and minimum wage 10 people are willing to accept to work as human resource specialists at a large financial firm. Name Gender Height Minimum Wage (Inches) (Dollars per week) Paolo M 67 $298 Ginny F 63 $311 Lucia F 66 $332 Eric M 71 $354 Kenji M 69 $375 Sharon F 66 $397 Paolo M 70 $411 Carlos M 70 $440 Van M 64 $452 Amy F 69 $474 The lowest weekly wage that the financial firm can spend in order to hire five human resource specialists is____. Suppose the hiring director of the financial firm prefers taller candidates because they think it will increase revenue, and so they impose a requirement that all newly hired human resource specialists must have a height of at least 67 inches. With this mandate in place, the weekly wage rate the financial firm now must pay in order to hire five human resource specialists increases by_____.arrow_forwardnot use ai pleasearrow_forwardnot use ai pleasearrow_forward
- Problem 3 Stata Output Analysis Suppose a study investigates the causal effect of education on wages. Table 1 reports the results of an OLS regression of wages (wage per hour in dollars) on education (years in education). Table 1 Source SS df MS Number of obs = 3,017 F(1, 3015) = 298.39 Model Residual 18904467 191011981 1 18904467 3,015 63353.8909 Prob > F 0.0000 R-squared 0.0901 Adj R-squared 0.0898 Total 209916448 3,016 69600.9444 Root MSE 251.7 wage Coef. Std. Err. t P>|t| [95% Conf. Interval] education cons 29.56644 183.9342 1.711605 23.15976 17.27 0.000 7.94 0.000 26.21041 138.5237 32.92247 229.3447 a. How would you write this relationship using the Core Model? (5 points) b. What is the value for B₁, the coefficient on Education? (2 points) C. What is the standard error of ẞ₁? (2 points) d. What is the R squared for the model? (2 points) e. What is the t statistic for ₁at the 5% level of significance? (2 points) Λ f. What is the 95% confidence interval for B₁? (2 points) Λ g.…arrow_forwardProblem 2 Hypothesis Testing Suppose you are interested in the effect of neighborhood crime incidents on high school graduation rates. You run the following regression model: Graduation; ßo+ß₁Crime; +ɛ¿ = You would like to test whether the neighborhood crime incidents have a statistically significant effect on high school graduation rate at the 5% level of significance (α = 0.05). You estimate the model and find that B₁ = -0.04 and se (B₁) = 0.008. a. Write down the null hypothesis and alternative hypothesis. (4 points) b. Calculate thet statistic of B₁. (5 points) C. What is the critical value of thet statistic for the 5% level of significance? (2 points) d. Calculate the 95% confidence interval for the coefficient on Crime? (6 points) e. Based on your answers to the questions b, c, and d, do you reject or fail to reject the null hypothesis you defined in question a? Justify your answer. (5 points) Λ f. Isẞ₁ statistically significant at the 5% level? (3 points)arrow_forwardProblem 1 Endogeneity & Bias The ACT (an abbreviation of American College Testing) is a standardized test used for college admissions in the United States. Suppose you are interested in whether ACT preparation improves ACT scores. Consider the following model: ACT=B+B Preparation,+e; where Preparation measures the number of hours spent on ACT preparation and ACT is ACT scores. Each student is denoted by the subscript i. Suppose you estimate = - 21 andß₁ = 0.9. a. What is the dependent variable? What is the independent variable? (3 points) b. How do you interpret ẞ = 21 in this context? (4 points) 0 C. How do you interpretß₁ = 0.9 in this context? (4 points) 1 d. Describe a scenario which can cause the independent variable to be endogenous. (4 points)arrow_forward
- How does mining raw materials fir tech companies like apple affect the humar right violation all over the worldarrow_forwardConsider the market for electricity. Suppose that a power plant dumps byproducts into a nearby river, creating a negative externality for those living downstream from the plant. Producing additional electricity imposes a constant per-unit external cost of $490. The following graph shows the demand (private value) curve and the supply (private cost) curve for electricity. Use the purple points (diamond symbol) to plot the social cost curve when the external cost is $490 per unit. PRICE (Dollars per unit of electricity) 1400 1260 1120 980 840 700 560 420 280 140 ° D 1 2 3 D Supply (Private Cost) Demand (Private Value) 5 6 7 QUANTITY (Units of electricity) Social Cost The market equilibrium quantity is units of electricity, but the socially optimal quantity of electricity production is units. To create an incentive for the firm to produce the socially optimal quantity of electricity, the government could impose a unit of electricity. perarrow_forwardHow do mining of raw materials for a tech industry affects the human rights in the worldarrow_forward


 Economics (MindTap Course List)EconomicsISBN:9781337617383Author:Roger A. ArnoldPublisher:Cengage Learning

 Exploring EconomicsEconomicsISBN:9781544336329Author:Robert L. SextonPublisher:SAGE Publications, Inc