Videos
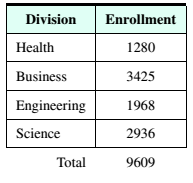
Education The following table shows the enrollments for the four divisions of a college. There are 50 new overhead projectors that are to be apportioned among the divisions based on the enrollments.
a. Use the Hamilton method to determine the number of projectors to be apportioned to each division.
b. Use the Jefferson method to determine the number of projectors to be apportioned to each division.
c. Use the Webster method to determine the number of projectors to be apportioned to each division.
(a)
Use the Hamilton method to determine tile number of projectors to be apportioned to each division.
Answer to Problem 1RE
Hence, the projectors to be apportioned each division Health, Business, Engineering, and Science is
Explanation of Solution
Given Information:
Number of overhead projectors
Concept used:
Calculation:
Since there is a total 50 new overhead projectors should be apportioned standard divisor is calculated by total number of enrollments divided by total number of new over head projectors that are to be apportioned, formula for standard divisor is,
Therefore,
Under the Hamilton plan, divide the enrollments of each division by the standard divisor and round the quotient down to a whole number
| Divisions | Enrollments | Quotient | Standard Quota |
| Health | | | |
| Business | | | |
| Engineering | | | |
| Science | | | |
| Total | | ||
When this happen the Hamilton plan calls for revisiting the calculation of the quotients and assigning an additional representative to the divisions with the largest decimal remaindeí process is continued until the number of representatives equals the number required by divisions. For divisions we have.
| Divisions | Enrollments | Quotient | Standard Quota | Number of overhead projectors |
| Health | | | | |
| Business | | | | |
| Engineering | | | | |
| Science | | | | |
| | |
Hence, the projectors to be apportioned each division Health, Business, Engineering, and Science is
Conclusion:
Hence, the projectors to be apportioned each division Health, Business, Engineering, and Science is
(b)
Use the Jefferson method to determine the number of projectors to be apportioned to each division.
Answer to Problem 1RE
The projectors to be apportioned each division Health, Business, Engineering, and Science is
Explanation of Solution
Given Information:
| Division | Enrollment |
| Health | |
| Business | |
| Engineering | |
| Science | |
| Total | |
Concept used:
Calculation:
For Jefferson plan we consider modified standard divisor by trial and error is
| Divisions | Enrollments | Quotient | Standard Quota |
| Health | | | |
| Business | | | |
| Engineering | | | |
| Science | | | |
| Total | | ||
Hence, the projectors to be apportioned each division Health, Business, Engineering, and Science is
Conclusion:
The projectors to be apportioned each division Health, Business, Engineering, and Science is
(c)
Use the Webster method to determine the number of projectors to be apportioned to each division.
Answer to Problem 1RE
The projectors to be apportioned each division Health, Business, Engineering, and
Science is
Explanation of Solution
Given Information:
Webster method
Concept used:
Webster method includes Enrollment, Quotient and number of overhead projects.
Calculation:
Now use Webster method to determine the number of projectors to be apportioned therefore,
| Divisions | Enrollments | Quotient | Standard Quota | Number of overhead projectors |
| Health | | | | |
| Business | | | | |
| Engineering | | | | |
| Science | | | | |
| Total | | | ||
Hence, the projectors to be apportioned each division Health, Business, Engineering, and
Science is
Conclusion:
The projectors to be apportioned each division Health, Business, Engineering, and
Science is
Want to see more full solutions like this?
Chapter 4 Solutions
Mathematical Excursions (MindTap Course List)


- The spread of an infectious disease is often modeled using the following autonomous differential equation: dI - - BI(N − I) − MI, dt where I is the number of infected people, N is the total size of the population being modeled, ẞ is a constant determining the rate of transmission, and μ is the rate at which people recover from infection. Close a) (5 points) Suppose ẞ = 0.01, N = 1000, and µ = 2. Find all equilibria. b) (5 points) For the equilbria in part a), determine whether each is stable or unstable. c) (3 points) Suppose ƒ(I) = d. Draw a phase plot of f against I. (You can use Wolfram Alpha or Desmos to plot the function, or draw the dt function by hand.) Identify the equilibria as stable or unstable in the graph. d) (2 points) Explain the biological meaning of these equilibria being stable or unstable.arrow_forwardFind the indefinite integral. Check Answer: 7x 4 + 1x dxarrow_forwardshow sketcharrow_forward
- Find the indefinite integral. Check Answer: 7x 4 + 1x dxarrow_forwardQuestion 1: Evaluate the following indefinite integrals. a) (5 points) sin(2x) 1 + cos² (x) dx b) (5 points) t(2t+5)³ dt c) (5 points) √ (In(v²)+1) 4 -dv ขarrow_forwardSuppose the Internal Revenue Service reported that the mean tax refund for the year 2022 was $3401. Assume the standard deviation is $82.5 and that the amounts refunded follow a normal probability distribution. Solve the following three parts? (For the answer to question 14, 15, and 16, start with making a bell curve. Identify on the bell curve where is mean, X, and area(s) to be determined. 1.What percent of the refunds are more than $3,500? 2. What percent of the refunds are more than $3500 but less than $3579? 3. What percent of the refunds are more than $3325 but less than $3579?arrow_forward
 Algebra: Structure And Method, Book 1AlgebraISBN:9780395977224Author:Richard G. Brown, Mary P. Dolciani, Robert H. Sorgenfrey, William L. ColePublisher:McDougal Littell