Understandable Statistics: Concepts And Methods
12th Edition
ISBN: 9781337517508
Author: Charles Henry Brase, Corrinne Pellillo Brase
Publisher: Cengage Learning
expand_more
expand_more
format_list_bulleted
Concept explainers
Videos
Textbook Question
Chapter 4, Problem 1DH
Look at Figure 4-11, Who’s Cracking the Books?
- (a) Does the figure show the
probability distribution of grade records for male students? for female students? Describe all the grade-record probability distributions shown in Figure 4-11. Find the probability that a male student selected at random has a grade record showing mostly As.
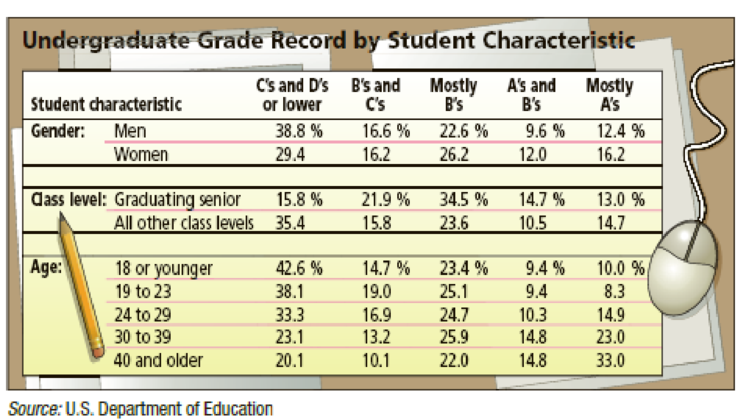
- (b) Is the probability distribution shown for all students making mostly As? Explain your answer. Hint: Do the percentages shown for mostly As add up to 1? Can Figure 4-11 be used to determine the probability that a student selected at random has mostly As? Can it be used to determine the probability that a female student selected at random has mostly As? What is the probability?
- (c) Can we use the information shown in the figure to determine the probability that a graduating senior has grades consisting of mostly Bs or higher? What is the probability?
- (d) Does Figure 4-11 give sufficient information to determine the probability that a student selected at random is in the age
range 19 to 23 and has grades that are mostly Bs? What is the probability that a student selected at random has grades that are mostly Bs, given that he or she is in the age range 19 to 23? - (e) Suppose that 65% of the students at State University are between 19 and 23 years of age. What is the probability that a student selected at random is in this age range and has grades that are mostly Bs?
Expert Solution & Answer
Want to see the full answer?
Check out a sample textbook solution
Students have asked these similar questions
Peggy conducted a study to identify the randomness of rainy days in fall. For 15 days, she recorded whether it rained that day or not. They denoted a rainy day with the letter R, a day without rain with the letter N.
R N N R R N N R R N N R R R R
Test the sequence for randomness. Use .
Consider the grades for the math and history exams for 10 students on a scale from 0 to 12 in the following table.
Student
Math
History
1
4
8
2
5
9
3
7
9
4
12
10
5
10
8
6
8
5
7
9
6
8
9
6
9
11
9
10
7
10
Compute the Spearman correlation coefficient. Round your answer to three decimal places.
To compare two elementary schools regarding teaching of reading skills, 12 sets of identical twins were used. In each case, one child was selected at random and sent to school A, and his or her twin was sent to school B. Near the end of fifth grade, an achievement test was given to each child. The results follow:
Twin Pair
1
2
3
4
5
6
School A
169
157
115
99
119
113
School B
123
157
112
99
121
122
Twin Pair
7
8
9
10
11
12
School A
120
121
124
145
138
117
School B
153
90
124
140
142
102
Suppose a sign test for matched pairs with a 1% level of significance is used to test the hypothesis that the schools have the same effectiveness in teaching reading skills against the alternate hypothesis that the schools have different levels of effectiveness in teaching reading skills. Let p denote portion of positive signs when the scores of school B are subtracted from the corresponding scores of school…
Chapter 4 Solutions
Understandable Statistics: Concepts And Methods
Ch. 4.1 - Statistical Literacy List three methods of...Ch. 4.1 - Prob. 2PCh. 4.1 - Prob. 3PCh. 4.1 - Statistical Literacy What is the law of large...Ch. 4.1 - Prob. 5PCh. 4.1 - Prob. 6PCh. 4.1 - Prob. 7PCh. 4.1 - Prob. 8PCh. 4.1 - Interpretation An investment opportunity boasts...Ch. 4.1 - Interpretation A sample space consists of 4 simple...
Ch. 4.1 - Critical Thinking Consider a family with 3...Ch. 4.1 - Prob. 12PCh. 4.1 - Prob. 13PCh. 4.1 - Critical Thinking (a) Explain why 0.41 cannot be...Ch. 4.1 - Myers-Briggs: Personality Types Isabel Briggs...Ch. 4.1 - General: Roll a Die (a) If you roll a single die...Ch. 4.1 - Psychology: Creativity When do creative people get...Ch. 4.1 - Agriculture: Cotton A botanist has developed a new...Ch. 4.1 - Expand Your Knowledge: Odds in Favor Sometimes...Ch. 4.1 - Expand Your Knowledge: Odds Against Betting odds...Ch. 4.1 - Business: Customers John runs a computer software...Ch. 4.2 - Statistical Literacy If two events are mutually...Ch. 4.2 - Statistical Literacy If two events A and B are...Ch. 4.2 - Basic Computation: Addition Rule Given P(A) = 0.3...Ch. 4.2 - Basic Computation: Addition Rule Given P(A) = 0.7...Ch. 4.2 - Prob. 5PCh. 4.2 - Prob. 6PCh. 4.2 - Prob. 7PCh. 4.2 - Prob. 8PCh. 4.2 - Prob. 9PCh. 4.2 - Prob. 10PCh. 4.2 - Prob. 11PCh. 4.2 - Prob. 12PCh. 4.2 - Prob. 13PCh. 4.2 - Prob. 14PCh. 4.2 - Prob. 15PCh. 4.2 - Environmental: Land Formations Arches National...Ch. 4.2 - Prob. 17PCh. 4.2 - General: Roll Two Dice You roll two fair dice, a...Ch. 4.2 - Prob. 19PCh. 4.2 - Prob. 20PCh. 4.2 - Prob. 21PCh. 4.2 - General: Deck of Cards You draw two cards from a...Ch. 4.2 - General: Deck of Cards You draw two cards from a...Ch. 4.2 - Prob. 24PCh. 4.2 - Marketing: Toys USA Today gave the information...Ch. 4.2 - Prob. 26PCh. 4.2 - Prob. 27PCh. 4.2 - Prob. 28PCh. 4.2 - Prob. 29PCh. 4.2 - Survey: Medical Tests Diagnostic tests of medical...Ch. 4.2 - Survey: Lung/Heart In an article titled Diagnostic...Ch. 4.2 - Survey: Customer Loyalty Are customers more loyal...Ch. 4.2 - Franchise Stores: Profits Wing Foot is a shoe...Ch. 4.2 - Education: College of Nursing At Litchfield...Ch. 4.2 - Medical: Tuberculosis The state medical school has...Ch. 4.2 - Prob. 36PCh. 4.2 - Brain Teasers Assume A and B are events such that...Ch. 4.2 - Brain Teasers Assume A and B are events such that...Ch. 4.2 - Prob. 39PCh. 4.2 - Prob. 40PCh. 4.2 - Prob. 41PCh. 4.2 - Prob. 42PCh. 4.2 - Prob. 43PCh. 4.2 - Prob. 44PCh. 4.2 - Prob. 45PCh. 4.2 - Prob. 46PCh. 4.2 - Prob. 47PCh. 4.2 - Prob. 48PCh. 4.2 - Prob. 49PCh. 4.2 - Prob. 50PCh. 4.2 - Prob. 51PCh. 4.2 - Prob. 52PCh. 4.3 - Prob. 1PCh. 4.3 - Prob. 2PCh. 4.3 - Prob. 3PCh. 4.3 - Prob. 4PCh. 4.3 - Tree Diagram (a) Draw a tree diagram to display...Ch. 4.3 - Tree Diagram (a) Draw a tree diagram to display...Ch. 4.3 - Prob. 7PCh. 4.3 - Prob. 8PCh. 4.3 - Prob. 9PCh. 4.3 - Multiplication Rule for Counting A sales...Ch. 4.3 - Counting: Agriculture Barbara is a research...Ch. 4.3 - Counting: Outcomes You toss a pair of dice. (a)...Ch. 4.3 - Compute P5,2.Ch. 4.3 - Prob. 14PCh. 4.3 - Compute P7,7.Ch. 4.3 - Compute P9,9.Ch. 4.3 - Compute C5,2.Ch. 4.3 - Compute C8,3.Ch. 4.3 - Prob. 19PCh. 4.3 - Prob. 20PCh. 4.3 - Counting: Hiring There are three nursing positions...Ch. 4.3 - Counting: Lottery In the Cash Now lottery game...Ch. 4.3 - Counting: Sports The University of Montana ski...Ch. 4.3 - Counting: Sales During the Computer Daze special...Ch. 4.3 - Counting: Hiring There are 15 qualified applicants...Ch. 4.3 - Counting: Grading One professor grades homework by...Ch. 4.3 - Prob. 27PCh. 4.3 - Counting: Powerball The Viewpoint of this section,...Ch. 4 - Prob. 1CRPCh. 4 - Prob. 2CRPCh. 4 - Prob. 3CRPCh. 4 - Prob. 4CRPCh. 4 - Prob. 5CRPCh. 4 - Prob. 6CRPCh. 4 - Prob. 7CRPCh. 4 - Critical Thinking For a class activity, your group...Ch. 4 - Prob. 9CRPCh. 4 - Prob. 10CRPCh. 4 - Prob. 11CRPCh. 4 - Prob. 12CRPCh. 4 - Prob. 13CRPCh. 4 - Prob. 14CRPCh. 4 - Prob. 15CRPCh. 4 - Prob. 16CRPCh. 4 - Prob. 17CRPCh. 4 - Prob. 18CRPCh. 4 - Prob. 19CRPCh. 4 - Prob. 20CRPCh. 4 - Look at Figure 4-11, Whos Cracking the Books? (a)...Ch. 4 - Prob. 2LCCh. 4 - Prob. 1UT
Knowledge Booster


Learn more about
Need a deep-dive on the concept behind this application? Look no further. Learn more about this topic, statistics and related others by exploring similar questions and additional content below.Similar questions
- A horse trainer teaches horses to jump by using two methods of instruction. Horses being taught by method A have a lead horse that accompanies each jump. Horses being taught by method B have no lead horse. The table shows the number of training sessions required before each horse performed the jumps properly. Method A 25 23 39 29 37 20 Method B 41 21 46 42 24 44 Method A 45 35 27 31 34 49 Method B 26 43 47 32 40 Use a rank-sum test with a5% level of significance to test the claim that there is no difference between the training sessions distributions. If the value of the sample test statistic R, the rank-sum, is 150, calculate the P-value. Round your answer to four decimal places.arrow_forwardA data processing company has a training program for new salespeople. After completing the training program, each trainee is ranked by his or her instructor. After a year of sales, the same class of trainees is again ranked by a company supervisor according to net value of the contracts they have acquired for the company. The results for a random sample of 11 salespeople trained in the last year follow, where x is rank in training class and y is rank in sales after 1 year. Lower ranks mean higher standing in class and higher net sales. Person 1 2 3 4 5 6 x rank 8 11 2 4 5 3 y rank 7 10 1 3 2 4 Person 7 8 9 10 11 x rank 7 9 10 1 6 y rank 8 11 9 6 5 Using a 1% level of significance, test the claim that the relation between x and y is monotone (either increasing or decreasing). Verify that the Spearman rank correlation coefficient . This implies that the P-value lies between 0.002 and 0.01. State…arrow_forwardSand and clay studies were conducted at a site in California. Twelve consecutive depths, each about 15 cm deep, were studied and the following percentages of sand in the soil were recorded. 34.4 27.1 30.8 28.0 32.2 27.6 32.8 25.2 31.4 33.5 24.7 28.4 Converting this sequence of numbers to a sequence of symbols A and B, where A indicates a value above the median and B denotes a value below the median gives ABABABABAABB. Test the sequence for randomness about the median with a 5% level of significance. Verify that the number of runs is 10. What is the upper critical value c2? arrow_forward
- Sand and clay studies were conducted at a site in California. Twelve consecutive depths, each about 15 cm deep, were studied and the following percentages of sand in the soil were recorded. 34.4 27.1 30.8 28.0 32.2 27.6 32.8 25.2 31.4 33.5 24.7 28.4 Converting this sequence of numbers to a sequence of symbols A and B, where A indicates a value above the median and B denotes a value below the median gives ABABABABAABB. Test the sequence for randomness about the median with a 5% level of significance. Verify that the number of runs is 10. What is the upper critical value c2?arrow_forward29% of all college students major in STEM (Science, Technology, Engineering, and Math). If 46 college students are randomly selected, find the probability thata. Exactly 11 of them major in STEM. b. At most 12 of them major in STEM. c. At least 11 of them major in STEM. d. Between 11 and 15 (including 11 and 15) of them major in STEM.arrow_forwardSand and clay studies were conducted at a site in California. Twelve consecutive depths, each about 15 cm deep, were studied and the following percentages of sand in the soil were recorded. 27.3 34.6 30.6 27.8 33.4 31.5 27.3 31.2 32.0 24.7 24.4 28.2 Test this sequence for randomness about the median. Converting this sequence of numbers to a sequence of symbols A and B, where A indicates a value above the median and B denotes a value below the median gives BAABAABAABBB. Verify that the number of runs is 7, the lower critical number is 3, and the upper critical number is 11. Use a 5% level of significance. State the conclusion of the test and interpret your results.arrow_forward
- 29% of all college students major in STEM (Science, Technology, Engineering, and Math). If 46 college students are randomly selected, find the probability thata. Exactly 11 of them major in STEM. b. At most 12 of them major in STEM. c. At least 11 of them major in STEM. d. Between 11 and 15 (including 11 and 15) of them major in STEM.arrow_forwardPlease solving problem2 Problem1 We consider a two-period binomial model with the following properties: each period lastsone (1) year and the current stock price is S0 = 4. On each period, the stock price doubleswhen it moves up and is reduced by half when it moves down. The annual interest rateon the money market is 25%. (This model is the same as in Prob. 1 of HW#2).We consider four options on this market: A European call option with maturity T = 2 years and strike price K = 5; A European put option with maturity T = 2 years and strike price K = 5; An American call option with maturity T = 2 years and strike price K = 5; An American put option with maturity T = 2 years and strike price K = 5.(a) Find the price at time 0 of both European options.(b) Find the price at time 0 of both American options. Compare your results with (a)and comment.(c) For each of the American options, describe the optimal exercising strategy.arrow_forwardProblem 1.We consider a two-period binomial model with the following properties: each period lastsone (1) year and the current stock price is S0 = 4. On each period, the stock price doubleswhen it moves up and is reduced by half when it moves down. The annual interest rateon the money market is 25%. We consider four options on this market: A European call option with maturity T = 2 years and strike price K = 5; A European put option with maturity T = 2 years and strike price K = 5; An American call option with maturity T = 2 years and strike price K = 5; An American put option with maturity T = 2 years and strike price K = 5.(a) Find the price at time 0 of both European options.(b) Find the price at time 0 of both American options. Compare your results with (a)and comment.(c) For each of the American options, describe the optimal exercising strategy.(d) We assume that you sell the American put to a market participant A for the pricefound in (b). Explain how you act on the market…arrow_forward
- What is the standard scores associated to the left of z is 0.1446arrow_forwardNote: The purpose of this problem below is to use computational techniques (Excelspreadsheet, Matlab, R, Python, etc.) and code the dynamic programming ideas seen inclass. Please provide the numerical answer to the questions as well as a sample of yourwork (spreadsheet, code file, etc.).We consider an N-period binomial model with the following properties: N = 60, thecurrent stock price is S0 = 1000; on each period, the stock price increases by 0.5% whenit moves up and decreases by 0.3% when it moves down. The annual interest rate on themoney market is 5%. (Notice that this model is a CRR model, which means that thebinomial tree is recombining.)(a) Find the price at time t0 = 0 of a (European) call option with strike price K = 1040and maturity T = 1 year.(b) Find the price at time t0 = 0 of a (European) put option with strike price K = 1040and maturity T = 1 year.(c) We consider now, that you are at time t5 (i.e. after 5 periods, which represents 1month later). Assume that the stock…arrow_forwardshow work in paperarrow_forward
arrow_back_ios
SEE MORE QUESTIONS
arrow_forward_ios
Recommended textbooks for you
 Holt Mcdougal Larson Pre-algebra: Student Edition...AlgebraISBN:9780547587776Author:HOLT MCDOUGALPublisher:HOLT MCDOUGAL
 Glencoe Algebra 1, Student Edition, 9780079039897...AlgebraISBN:9780079039897Author:CarterPublisher:McGraw Hill
Holt Mcdougal Larson Pre-algebra: Student Edition...
Algebra
ISBN:9780547587776
Author:HOLT MCDOUGAL
Publisher:HOLT MCDOUGAL
Glencoe Algebra 1, Student Edition, 9780079039897...
Algebra
ISBN:9780079039897
Author:Carter
Publisher:McGraw Hill
Mod-01 Lec-01 Discrete probability distributions (Part 1); Author: nptelhrd;https://www.youtube.com/watch?v=6x1pL9Yov1k;License: Standard YouTube License, CC-BY
Discrete Probability Distributions; Author: Learn Something;https://www.youtube.com/watch?v=m9U4UelWLFs;License: Standard YouTube License, CC-BY
Probability Distribution Functions (PMF, PDF, CDF); Author: zedstatistics;https://www.youtube.com/watch?v=YXLVjCKVP7U;License: Standard YouTube License, CC-BY
Discrete Distributions: Binomial, Poisson and Hypergeometric | Statistics for Data Science; Author: Dr. Bharatendra Rai;https://www.youtube.com/watch?v=lHhyy4JMigg;License: Standard Youtube License