Subpart (a):
To illustrate the given situation with
Subpart (a):
Explanation of Solution
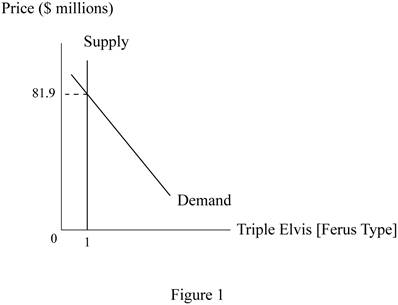
Figure 1 illustrates the

Figure 1 shows the
Concept introduction:
Demand curve: A demand curve is a graph which shows the quantities of a commodity that the consumers will buy at different price levels.
Supply curve: A supply curve is a graph which shows the quantities of a commodity that the producers are willing to sell at different price levels.
Subpart (b):
To illustrate the given situation with supply and demand curves.
Subpart (b):
Explanation of Solution
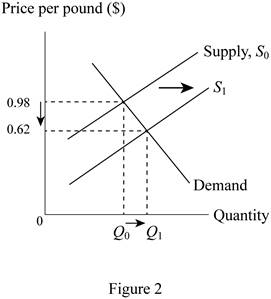
Figure 2 illustrates the change in market equilibrium.

Figure 2 shows the demand and supply curves for the hogs. The horizontal axis measures the quantity and the vertical axis measures the price of the commodity. The increase in the supply of the hogs has led to a rightward shift of the supply curve, all while the demand remains unchanged. As a result, the equilibrium changes and the prices decrease from 98 cents to 62 cents and the quantity increases from Q0 to Q1.
Concept introduction:
Demand curve: A demand curve is a graph which shows the quantities of a commodity that the consumers will buy at different price levels.
Supply curve: A supply curve is a graph which shows the quantities of a commodity that the producers are willing to sell at different price levels.
Subpart (c):
To illustrate the given situation with supply and demand curves.
Subpart (c):
Explanation of Solution
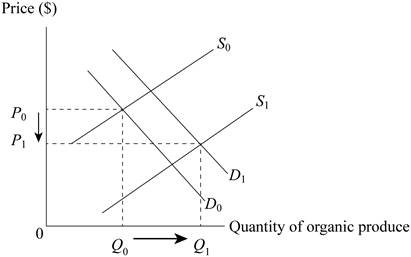
Figure 3 illustrates the change in market equilibrium.

Figure 3 shows the demand and supply curves for the organic produce. The horizontal axis measures the quantity and the vertical axis measures the price of the commodity. The initial increase in the demand for organic produce led to the shift of the demand curve from D0 to D1. However, the increase in the number of farmers producing the organic produce also increased, leading to an increase in the supply of the product which shifts the supply curve from S0 to S1. The combined effect is that the price of organic produce reduces from P0 to P1 as the quantity supplied increases from Q0 to Q1.
Concept introduction:
Demand curve: A demand curve is a graph which shows the quantities of a commodity that the consumers will buy at different price levels.
Supply curve: A supply curve is a graph which shows the quantities of a commodity that the producers are willing to sell at different price levels.
Want to see more full solutions like this?
Chapter 4 Solutions
Principles of Microeconomics, Student Value Edition Plus MyLab Economics with Pearson eText -- Access Card Package (12th Edition)
- Use the four-step process to analyze the impact of a Deduction in tariffs on imports of iPods on the equilibrium price and quantity of Sony Walkman-type products.arrow_forwardWhich of the following changes in the financial market will lead In an increase in the quantity of loans made and received: a rise in demand a fall in demand a rise in supply a fall in supplyarrow_forwardThe following table summarizes information about the market for principles of economics textbooks: Price Quantity Demanded per Year Quantity Supplied per Year $45 4,300 300 55 2,300 700 65 1,300 1,300 75 800 2,100 85 650 3,100 What is the market equilibrium price and quantity of textbooks? To quell outrage over tuition increases, the college places a $55 limit on the price of textbooks. How many textbooks will be sold now? While the price limit is still in effect, automated publishing increases the efficiency of textbook production. Show graphically the likely effect of this innovation on the market price and quantity.arrow_forward
- 59arrow_forwardThen, looking at the data in each of the following schedules, label the corresponding schedule either “Demand Schedule" or "Supply Schedule;" Schedule 1.1: Price of Eggs (per dozen) Quantity of Eggs (dozen) $8.00 10 $5.00 8 $3.00 $2.00 4 2 $1.50 1 Schedule 1.2: Price of Eggs (per dozen) Quantity of Eggs (dozen) $8.00 1 $5.00 $3.00 4 $2.00 $1.50 8 10 Next, graphically illustrate the supply curve and demand curve for eggs, being certain that you fully label the graph; Then, briefly distinguish the difference between a movement along a curve and a shift of the curve. In doing so, be certain to list in your answer the factors shifting the demand curve as well as the factors shifting the supply curve;arrow_forwardSuppose a decrease in the world demand for desktop computers causes the price of desktop computers to fall from $600 to $500. Before the fall in demand, Juna, a local computer dealer in Japan, used to produce 9,000 desktop computers and exported 50 percent of it to other countries every week. However, after the fall in demand, Juna reduced its production to 8,000 units and exports only 40 percent of its total output.a. What are the changes in the quantity sold to domestic consumersb. What are the changes in the consumer surplus?c. Sketch a diagram to illustrate the changes for Juna.arrow_forward
- The following graph shows the monthly demand and supply curves in the market for hats. (graph in image) The equilibrium price in this market is $______ per hat, and the equilibrium quantity is ___ hats bought and sold per month. Complete the following table by indicating at each price whether there is a shortage or surplus in the market, the amount of that shortage or surplus, and whether this places upward or downward pressure on prices. Price Shortage or Surplus Shortage or Surplus Amount Pressure 60 40arrow_forwardThe figure above shows a market that is originally at equilibrium at Point A, the intersection between been supply curve S1 and demand curve D1. Which of the following events would result in the market reaching a new equilibrium at Point C? Question 10Answer a. An increase in supply and a decrease in the quantity demanded. b. A decrease in supply and an increase in the quantity demanded. c. A decrease in the quantity supplied and a decrease in demand. d. A decrease in supply and a decrease in the quantity demanded.arrow_forwardThe following graph shows the market for pianos in 2009. Between 2009 and 2010, the equilibrium quantity of pianos remained constant, but the and the equilibrium price of pianos decreased. From this, you can conclude that between 2009 and 2010, the supply of pianos demand for pianos Adjust the graph to illustrate your answer by showing the positions of the supply and demand curves in 2010. Note: Select and drag one or both of the curves to the desired position. Curves will snap into position, so if you try to move a curve and it snaps back to its original position, just drag it a little farther. Supply Demand Supply Demand QUANTITY (Pianos) PRICE (Dollars per piano)arrow_forward
- List six basic determinants of market supply that could cause supply to increase. Be specific with those determinants (or causes, factors, or shifters of demand curve) how they will increase market supply.arrow_forwardIn the market for fiction books, the price of a fiction book falls and nothing else changes. Show the effect in the graph. Draw either a new supply curve or an arrow along the curve showing the direction of change. Price (dollars per fiction book) 120.00 90.00 60.00- When the price of a fiction book falls and nothing else changes, O A. the supply of fiction books decreases and the quantity of fiction books supplied also decreases 30.00 O B. the supply of fiction books increases and the quantity of fiction books supplied does not change Oc. the supply of fiction books increases and the quantity of fiction books supplied also increases 0.00- Quantity (millions of fiction books per year) O D. the quantity of fiction books supplied changes and supply does not change >>> Draw only the objects specified in the questionarrow_forwardOver the past 20 years, the average price of avocados has more than doubled. Assume that the price of avocados is determined by the forces of supply and demand. Using concepts that you have learned about supply and demand, explain whether the following is or is not a cause of the increase in price of avocado. Restrictions on imports of avocados from Mexico were gradually lifted. Improved production methods allowed for slower ripening of avocados and therefore more avocados can be reliably shipped. Mexican food, which regularly features avocados, has become more popular.arrow_forward
 Exploring EconomicsEconomicsISBN:9781544336329Author:Robert L. SextonPublisher:SAGE Publications, Inc
 Principles of MicroeconomicsEconomicsISBN:9781305156050Author:N. Gregory MankiwPublisher:Cengage Learning
 Microeconomics: Principles & PolicyEconomicsISBN:9781337794992Author:William J. Baumol, Alan S. Blinder, John L. SolowPublisher:Cengage Learning
 Economics (MindTap Course List)EconomicsISBN:9781337617383Author:Roger A. ArnoldPublisher:Cengage Learning


