Concept explainers
Videos
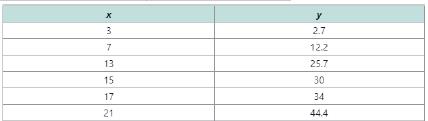
For Exercises 39-46, a table of data is given.
a. Graph the points and from visual inspection, select the model that would best fit the data. Choose from
b. Use a graphing utility to find a function that fits the data.
Want to see the full answer?
Check out a sample textbook solution
Chapter 3 Solutions
Precalculus
Additional Math Textbook Solutions
University Calculus: Early Transcendentals (3rd Edition)
Thomas' Calculus: Early Transcendentals (14th Edition)
Precalculus (10th Edition)
University Calculus: Early Transcendentals (4th Edition)
Single Variable Calculus: Early Transcendentals (2nd Edition) - Standalone book


- A passenger jet passed through an altitude of 13,000 feet 8 minutes after takeoff and was climbing at a rate of 1,250 feet per minute. Find a linear model for the altitude A (in ft) of the jet t minutes after takeoff. A = Use your model to predict the altitude (in ft) of the jet 24 minutes into the flight. ftarrow_forward(c) Th Data Table Total Length (cm) 138.0 135.0 130.0 120.5 149.0 141.0 141.0 150.0 166.0 151.5 129.5 150.0 Print Weight (kg) 110 60 90 60 85 105 95 85 155 140 105 110 Done 0 X Critical Values for the Correlation Coefficient 3 0.997 4 0.950 5 0.878 6 0.811 7 0.754 8 0.707 9 0.666 10 0.632 11 0.602 12 0.576 13 0.553 14 0.532 15 0.514 16 0.497 17 0.482 18 0.468 19 0.456 20 0.444 21 0.433 22 0.423 23 0.413 24 0.404 25 0.396 26 0.388 27 0.381 0371 X not practical to v parts (a) througharrow_forwardA cyclist is tracking weekly mileage while training for a race. The table models the number of miles, y, for a given week, x. Which type of model would best fit the data, and why?arrow_forward
- The number of hours of video uploaded to YouTube per minute is shown in the table below. Year # of hours of video uploaded per minute 2007 6 2008 10 2009 20 2010 24 2011 48 2012 60 2013 100 Let y be the video upload rate at x years since 2005. Construct a scatterplot by hand. Is the relationship linear or exponential? Increasing or decreasing? Write an equation modeling the number of hours of video uploaded per minute if the initial number of hours is 2.6 and it increases by 59%. Use your equation to find the number of hours uploaded in 2015.arrow_forwardIs the following table created with an exponential or a linear equation? Y 1 10 13 3 16 4 19arrow_forwardThe cost of fuel is the largest component of cost of ownership for most vehicles. Fuel cost is (almost) inversely proportional to gas mileage; higher gas mileage means lower fuel cost and vice-versa. If you keep track of the number of miles driven on each tank of gas as well as how much gas is purchased, it is easy to calculate gas mileage; many cell phone apps exist to track this. The data in the following table is the gas mileage for Mr. Hebert's 2015 Jeep Wrangler Unlimited. 12.85 14.98 15.36 17.09 18.86 13.28 15.11 15.62 17.50 19.07 13.48 15.12 15.65 17.66 20.91 14.65 15.13 16.41 18.17 21.17 14.71 15.14 16.80 18.27 22.11 g. The manufacturer (by way of the EPA) print city, highway, and combined fuel economy on the window sticker of each new car. The combined fuel economy rating for Mr. Hebert's Jeep Wrangler is 18 MPG. From the point of view of Mr. Hebert's credit card bill, getting less than the…arrow_forward
- The cost of fuel is the largest component of cost of ownership for most vehicles. Fuel cost is (almost) inversely proportional to gas mileage; higher gas mileage means lower fuel cost and vice-versa. If you keep track of the number of miles driven on each tank of gas as well as how much gas is purchased, it is easy to calculate gas mileage; many cell phone apps exist to track this. The data in the following table is the gas mileage for Mr. Hebert's 2015 Jeep Wrangler Unlimited. 12.85 14.98 15.36 17.09 18.86 13.28 15.11 15.62 17.50 19.07 13.48 15.12 15.65 17.66 20.91 14.65 15.13 16.41 18.17 21.17 14.71 15.14 16.80 18.27 22.11 c. Find the five number summary. enter your response here, enter your response here, enter your response here, enter your response here, enter your response herearrow_forwardThe cost of fuel is the largest component of cost of ownership for most vehicles. Fuel cost is (almost) inversely proportional to gas mileage; higher gas mileage means lower fuel cost and vice-versa. If you keep track of the number of miles driven on each tank of gas as well as how much gas is purchased, it is easy to calculate gas mileage; many cell phone apps exist to track this. The data in the following table is the gas mileage for Mr. Hebert's 2015 Jeep Wrangler Unlimited. 12.85 14.98 15.36 17.09 18.86 13.28 15.11 15.62 17.50 19.07 13.48 15.12 15.65 17.66 20.91 14.65 15.13 16.41 18.17 21.17 14.71 15.14 16.80 18.27 22.11 e. Does this data show any skew or symmetry? A. Left - Skewed B. Right - Skewed C. Symmetricalarrow_forwardThe cost of fuel is the largest component of cost of ownership for most vehicles. Fuel cost is (almost) inversely proportional to gas mileage; higher gas mileage means lower fuel cost and vice-versa. If you keep track of the number of miles driven on each tank of gas as well as how much gas is purchased, it is easy to calculate gas mileage; many cell phone apps exist to track this. The data in the following table is the gas mileage for Mr. Hebert's 2015 Jeep Wrangler Unlimited. 12.85 14.98 15.36 17.09 18.86 13.28 15.11 15.62 17.50 19.07 13.48 15.12 15.65 17.66 20.91 14.65 15.13 16.41 18.17 21.17 14.71 15.14 16.80 18.27 22.11 a. Find the average fuel economy. x =enter your response here (Round your answer to 3 decimal places.)arrow_forward
- The cost of fuel is the largest component of cost of ownership for most vehicles. Fuel cost is (almost) inversely proportional to gas mileage; higher gas mileage means lower fuel cost and vice-versa. If you keep track of the number of miles driven on each tank of gas as well as how much gas is purchased, it is easy to calculate gas mileage; many cell phone apps exist to track this. The data in the following table is the gas mileage for Mr. Hebert's 2015 Jeep Wrangler Unlimited. 12.85 14.98 15.36 17.09 18.86 13.28 15.11 15.62 17.50 19.07 13.48 15.12 15.65 17.66 20.91 14.65 15.13 16.41 18.17 21.17 14.71 15.14 16.80 18.27 22.11 b. Find the standard deviation for this sample. s = enter your response here (Round your answer to 4 decimal places.)arrow_forwardThe cost of fuel is the largest component of cost of ownership for most vehicles. Fuel cost is (almost) inversely proportional to gas mileage; higher gas mileage means lower fuel cost and vice-versa. If you keep track of the number of miles driven on each tank of gas as well as how much gas is purchased, it is easy to calculate gas mileage; many cell phone apps exist to track this. The data in the following table is the gas mileage for Mr. Hebert's 2015 Jeep Wrangler Unlimited. 12.85 14.98 15.36 17.09 18.86 13.28 15.11 15.62 17.50 19.07 13.48 15.12 15.65 17.66 20.91 14.65 15.13 16.41 18.17 21.17 14.71 15.14 16.80 18.27 22.11 f. Construct a 95% confidence interval to estimate the average fuel economy of the jeep. enter your response here≤μ≤enter your response here (Round your answers to 2 decimal places.)arrow_forwardThe cost of fuel is the largest component of cost of ownership for most vehicles. Fuel cost is (almost) inversely proportional to gas mileage; higher gas mileage means lower fuel cost and vice-versa. If you keep track of the number of miles driven on each tank of gas as well as how much gas is purchased, it is easy to calculate gas mileage; many cell phone apps exist to track this. The data in the following table is the gas mileage for Mr. Hebert's 2015 Jeep Wrangler Unlimited. 12.85 14.98 15.36 17.09 18.86 13.28 15.11 15.62 17.50 19.07 13.48 15.12 15.65 17.66 20.91 14.65 15.13 16.41 18.17 21.17 14.71 15.14 16.80 18.27 22.11 d. Construct a box-plot of this data.arrow_forward
 Glencoe Algebra 1, Student Edition, 9780079039897...AlgebraISBN:9780079039897Author:CarterPublisher:McGraw Hill
 Algebra & Trigonometry with Analytic GeometryAlgebraISBN:9781133382119Author:SwokowskiPublisher:Cengage
 Trigonometry (MindTap Course List)TrigonometryISBN:9781337278461Author:Ron LarsonPublisher:Cengage Learning