
Concept explainers
Videos
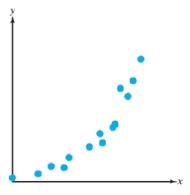
For Exercises 35-38, a graph of data is given. From visual inspection, which model would best fit the data? Choose from
Want to see the full answer?
Check out a sample textbook solution
Chapter 3 Solutions
Precalculus
Additional Math Textbook Solutions
University Calculus: Early Transcendentals (3rd Edition)
Single Variable Calculus: Early Transcendentals (2nd Edition) - Standalone book
Thomas' Calculus: Early Transcendentals (14th Edition)
University Calculus: Early Transcendentals (4th Edition)
Calculus and Its Applications (11th Edition)


- Enter the data from Table 2 into a graphing calculator and graph the ranking scatter plot. Determine whetherthe data from the table would likely represent a function that is linear, exponential, or logarithmic.arrow_forwardWhat might a scatterplot of data points look like if it were best described by a logarithmic model?arrow_forwardExplain why the values of an increasing exponentialfunction will eventually overtake the valuesof anincreasing linear function.arrow_forward
- The population of a culture of bacteria is modeled by the logistic equation P(t)=14,2501+29e0.62t where t is inarrow_forwardFirst, create a scatter plot for the data in the table. Then, use the shape of the scatter plot given to determine if the data are best modeled by a linear function, an exponential function, a logarithmic function, or a quadratic function. OA 0+ quadratic function 0 linear function Q Q O C. exponential function Q X y 0.05 4.1 0.4 logarithmic function 3 2 1 3.5 0.2 1 2 4 0.15 5 0.1 Qarrow_forwardThe following equation was estimated using the data in CEOSALI: log (salary) = 4.322 + .276 log(sales) + .0215 roe – .00008 roe? (.00026) (.324) (.033) n = 209, R? = .282. (.0129) This equation allows roe to have a diminishing effect on log(salary). Is this generality necessary? Explain why or why not.arrow_forward
- d) We conduct a regression of life on school, reg1, reg2, reg3, reg4, loggdp. The regression output is reported in Table 4. Interpret the sign and magnitude of loggdp. In answering the question, recall that loggdp is the base-10 logarithm of the per- capita GDP.arrow_forwardThe data in the table below shows the intensity and loudness level of variaous sounds a. Create a scatter plot for the data. b. Use the scatter plot to determine whether an exponential function, a logarithmic function, or a linear function is the best choice for modeling the data Intensity-watt per Meter2 (x) 0.1 3 25 97 Loudness Level- decibels (y) 109 120 131 141arrow_forwardA researcher investigating the factors related to a country's economic growth between 2005 and 2010 estimates the following model for a sample of countries (using cross sectional data): GROWTH = a + b × GDPH2005 + cx INV + d x EDUC + ex RIGHTS + fx ELEC where: GROWTH is the country's economic growth (percent change of GDP per person at constant prices between 2005 and 2010); GDPH2005 is the log of the country's level of GDP per person in 2005 (US$ at 2005 prices); INV is the country's share of gross investment in fixed capital (Gross Fixed Capital Formation) as a percentage of GDP in 2005; EDUC is an indicator of the level of education of the population (total enrolment in secondary schools as a % of population aged 15 and over); RIGHTS is an indicator of the strength of legal rights (0=weak to 12-strong); ELEC is the percentage of population who have access to electricity; The results of the estimation are: Variables GDPH2005 INV EDUC RIGHTS ELEC Constant INV RIGHTS ELEC EDUC…arrow_forward
- The Richter scale measures the magnitude, M, of an earthquake as a function of its intensity, I, and the intensity of a reference earthquake, Io. M = log() Which equation calculates the magnitude of an earthquake with an intensity 10,000 times that of the reference earthquake? O A. M = log(10,000) %D (10,000 O B. log() M = OC. M = log(10,000) %3D log(1mm) OD. M = Reset Nextarrow_forwardBacteria growth was measured over a one-month period. Scatterplot A displays the number of cells measured over the recorded number of days. Two transformations of the data are shown in the next two graphs. Scatterplot B displays the relationship between the number of days and the natural log of the number of cells of bacteria. Scatterplot C displays the relationship between the natural log of the number of days and the natural log of the number of cells of bacteria. Which model best represents the relationship between the number of days and the number of cells of bacteria? A linear model would best represent the relationship because scatterplot A is fairly linear. An exponential model would best represent the relationship because scatterplot B is fairly linear. A linear model would best represent the relationship because scatterplot B is fairly linear. A power model would best represent the relationship because scatterplot C is fairly linear.arrow_forwardThe table below is a record of the number of miles driven between stops for gas and the amount of money spent to fill up the gas tank in Sophia’s car over several months. Sophia’s Gas Fill Up LogMiles Driven, x 346 309 336 310 325 274 324Cost to Fill up ($), y 27.69 25.08 25.74 24.56 24.94 22.05 26.28 Step 1 of 2: Find an equation of the least-squares regression line. Round your answer to three decimal places, if necessary.arrow_forward
 Glencoe Algebra 1, Student Edition, 9780079039897...AlgebraISBN:9780079039897Author:CarterPublisher:McGraw Hill
 Algebra & Trigonometry with Analytic GeometryAlgebraISBN:9781133382119Author:SwokowskiPublisher:Cengage