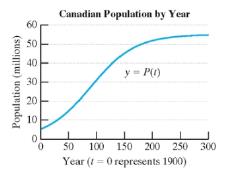
The population of Canada P t (in millions) since January 1, 1900, can be approximated by P t = 55.1 1 + 9.6 e − 0.02515 t where t is the number of years since January 1, 1900. a. Evaluate P 0 and interpret its meaning in the context of this problem. b. Use the function to approximate the Canadian population on January 1, 2015. Round to the nearest tenth of a million? c. Use the function to approximate the Canadian population on January 1, 2040. d. From the model, during which year would the Canadian population reach 45 million? e. What value will the term 9.6 e 0.02515 t approach as t → ∞ ? f. Determine the limiting value of P t .
The population of Canada P t (in millions) since January 1, 1900, can be approximated by P t = 55.1 1 + 9.6 e − 0.02515 t where t is the number of years since January 1, 1900. a. Evaluate P 0 and interpret its meaning in the context of this problem. b. Use the function to approximate the Canadian population on January 1, 2015. Round to the nearest tenth of a million? c. Use the function to approximate the Canadian population on January 1, 2040. d. From the model, during which year would the Canadian population reach 45 million? e. What value will the term 9.6 e 0.02515 t approach as t → ∞ ? f. Determine the limiting value of P t .
The population of Canada
P
t
(in millions) since January 1, 1900, can be approximated by
P
t
=
55.1
1
+
9.6
e
−
0.02515
t
where t is the number of years since January 1, 1900.
a. Evaluate
P
0
and interpret its meaning in the context of this problem.
b. Use the function to approximate the Canadian population on January 1, 2015. Round to the nearest tenth of a million?
c. Use the function to approximate the Canadian population on January 1, 2040.
d. From the model, during which year would the Canadian population reach 45 million?
e. What value will the term
9.6
e
0.02515
t
approach as
t
→
∞
?
Consider the function f(x) = x²-1.
(a) Find the instantaneous rate of change of f(x) at x=1 using the definition of the derivative.
Show all your steps clearly.
(b) Sketch the graph of f(x) around x = 1. Draw the secant line passing through the points on the
graph where x 1 and x->
1+h (for a small positive value of h, illustrate conceptually). Then,
draw the tangent line to the graph at x=1. Explain how the slope of the tangent line relates to the
value you found in part (a).
(c) In a few sentences, explain what the instantaneous rate of change of f(x) at x = 1 represents in
the context of the graph of f(x). How does the rate of change of this function vary at different
points?
1. The graph of ƒ is given. Use the graph to evaluate each of the following values. If a value does not exist,
state that fact.
и
(a) f'(-5)
(b) f'(-3)
(c) f'(0)
(d) f'(5)
2. Find an equation of the tangent line to the graph of y = g(x) at x = 5 if g(5) = −3 and g'(5)
=
4.
-
3. If an equation of the tangent line to the graph of y = f(x) at the point where x 2 is y = 4x — 5, find ƒ(2)
and f'(2).
Elementary Statistics: Picturing the World (7th Edition)
Knowledge Booster
Learn more about
Need a deep-dive on the concept behind this application? Look no further. Learn more about this topic, calculus and related others by exploring similar questions and additional content below.
Area Between The Curve Problem No 1 - Applications Of Definite Integration - Diploma Maths II; Author: Ekeeda;https://www.youtube.com/watch?v=q3ZU0GnGaxA;License: Standard YouTube License, CC-BY


 College Algebra (MindTap Course List)AlgebraISBN:9781305652231Author:R. David Gustafson, Jeff HughesPublisher:Cengage Learning
 Algebra & Trigonometry with Analytic GeometryAlgebraISBN:9781133382119Author:SwokowskiPublisher:Cengage
 Algebra for College StudentsAlgebraISBN:9781285195780Author:Jerome E. Kaufmann, Karen L. SchwittersPublisher:Cengage Learning
 Big Ideas Math A Bridge To Success Algebra 1: Stu...AlgebraISBN:9781680331141Author:HOUGHTON MIFFLIN HARCOURTPublisher:Houghton Mifflin Harcourt
 Elementary Linear Algebra (MindTap Course List)AlgebraISBN:9781305658004Author:Ron LarsonPublisher:Cengage Learning