
Concept explainers
Videos
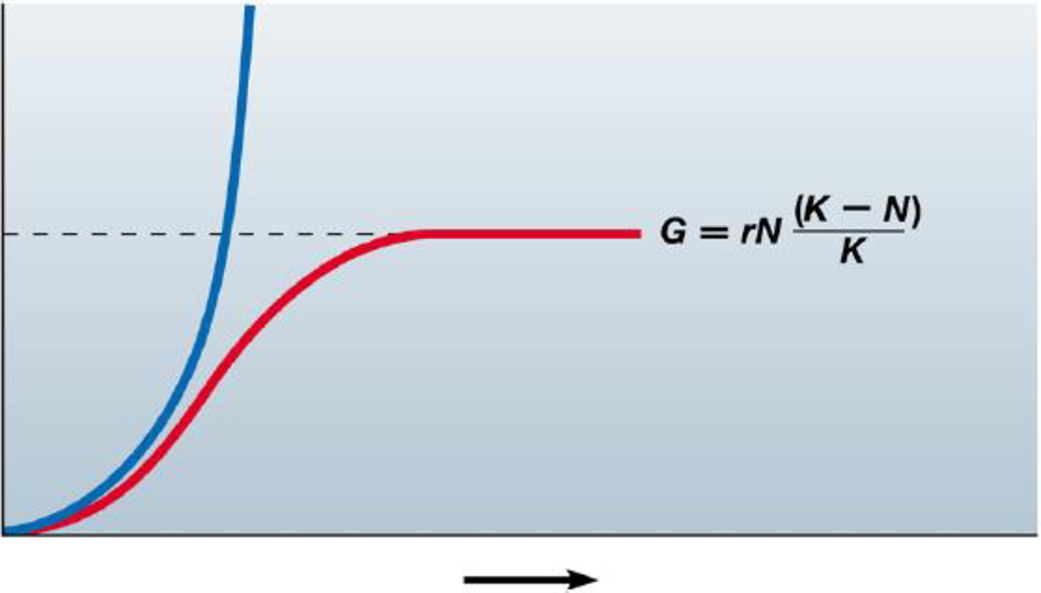
Use this graph of the idealized exponential and
a. Label the axes and curves on the graph.
b. Give the formula that describes the blue curve.
c. What does the dotted line represent?
d. For each curve, indicate and explain where population growth is the most rapid.
e. Which of these curves best represents global human population growth?
a.
To label: The axis and the curves of the graph.
Introduction: Exponential growth curve is the J-shaped curve that is ever increasing in nature. The logistic growth curve is an S shaped curve in which the growth of the population ceases after a certain point which can be represented as the carrying capacity of the population.
Answer to Problem 1CC
Correct answer:
X-axis is time, Y-axis is population size. Blue/thick curve is the exponential growth and red/thin curve is logistic curve
Explanation of Solution
Graphical representation: Fig: 1 shows the graph depicting the logistic and exponential growth curve.
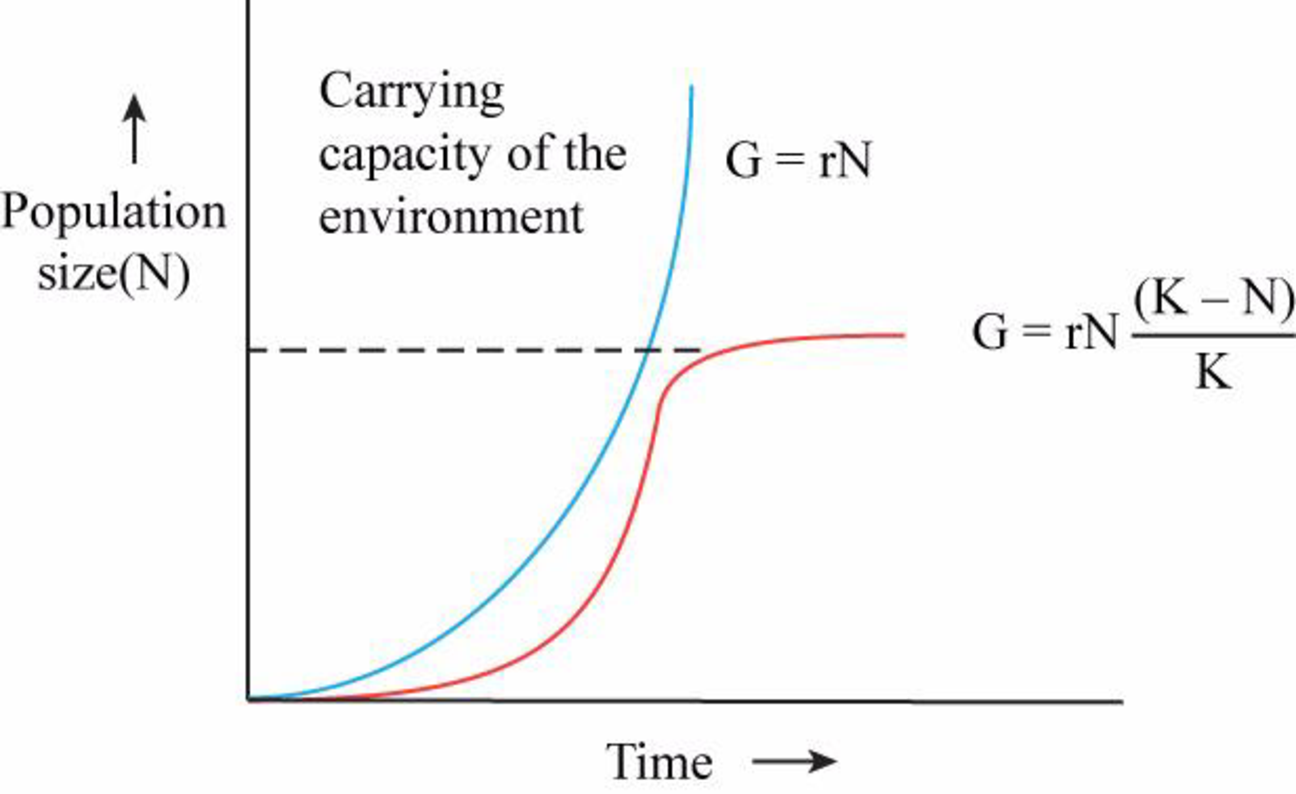
Fig. 1: The graph depicting the logistic and exponential growth curve.
The X-axis of the graph represents the time taken for growth and the Y-axis of the graph represents the size of the population. The blue/thick curve is the exponential growth curve and red/thin curve is logistic growth curve. Hence the correct answer is X-axis is time, Y-axis is population size. Blue/thick curve is the exponential growth and red/thin curve is logistic curve
b.
To give: The formula that describes the blue curve.
Answer to Problem 1CC
Correct answer:
Explanation of Solution
Refer to Fig.1; the blue curve can be described by the formula
c.
To determine: What does the dotted line represents.
Answer to Problem 1CC
Correct answer:
Carrying capacity of the environment (K)
Explanation of Solution
Refer to Fig.1; the dotted line represented on the graph is the carrying capacity of the environment. Hence the correct answer is carrying capacity of the environment (K)
d.
To determine: What does each curve represents.
Answer to Problem 1CC
Correct answer:
Population of logistic curve is most rapid at half of the carrying capacity. Population of exponential growth is most rapid throughout the curve as it is continuously increasing.
Explanation of Solution
Refer to Fig.1; the population growth is most rapid when population attains half of the carrying capacity in logistic curve and the population growth is continuously increasing in the exponential growth curve. Hence the correct answer half of the carrying capacity in logistic curve and continuous growth in exponential growth.
e.
To determine: The curve which represents the global human population.
Answer to Problem 1CC
Correct answer:
Exponential growth curve
Explanation of Solution
Refer to Fig.1; it is the J shaped curve that is continuously increasing is the exponential growth curve. The worldwide population can be represented by this curve as the population is ever increasing. Hence the correct answer is exponential growth curve.
Want to see more full solutions like this?
Chapter 36 Solutions
CAMPBEL BIOLOGY:CONCEPTS & CONNECTIONS


- You intend to insert patched dominant negative DNA into the left half of the neural tube of a chick. 1) Which side of the neural tube would you put the positive electrode to ensure that the DNA ends up on the left side? 2) What would be the internal (within the embryo) control for this experiment? 3) How can you be sure that the electroporation method itself is not impacting the embryo? 4) What would you do to ensure that the electroporation is working? How can you tell?arrow_forwardDescribe a method to document the diffusion path and gradient of Sonic Hedgehog through the chicken embryo. If modifying the protein, what is one thing you have to consider in regards to maintaining the protein’s function?arrow_forwardThe following table is from Kumar et. al. Highly Selective Dopamine D3 Receptor (DR) Antagonists and Partial Agonists Based on Eticlopride and the D3R Crystal Structure: New Leads for Opioid Dependence Treatment. J. Med Chem 2016.arrow_forward
- The following figure is from Caterina et al. The capsaicin receptor: a heat activated ion channel in the pain pathway. Nature, 1997. Black boxes indicate capsaicin, white circles indicate resinferatoxin. You are a chef in a fancy new science-themed restaurant. You have a recipe that calls for 1 teaspoon of resinferatoxin, but you feel uncomfortable serving foods with "toxins" in them. How much capsaicin could you substitute instead?arrow_forwardWhat protein is necessary for packaging acetylcholine into synaptic vesicles?arrow_forward1. Match each vocabulary term to its best descriptor A. affinity B. efficacy C. inert D. mimic E. how drugs move through body F. how drugs bind Kd Bmax Agonist Antagonist Pharmacokinetics Pharmacodynamicsarrow_forward
- 50 mg dose of a drug is given orally to a patient. The bioavailability of the drug is 0.2. What is the volume of distribution of the drug if the plasma concentration is 1 mg/L? Be sure to provide units.arrow_forwardDetermine Kd and Bmax from the following Scatchard plot. Make sure to include units.arrow_forwardChoose a catecholamine neurotransmitter and describe/draw the components of the synapse important for its signaling including synthesis, packaging into vesicles, receptors, transporters/degradative enzymes. Describe 2 drugs that can act on this system.arrow_forward
- The following figure is from Caterina et al. The capsaicin receptor: a heat activated ion channel in the pain pathway. Nature, 1997. Black boxes indicate capsaicin, white circles indicate resinferatoxin. a) Which has a higher potency? b) Which is has a higher efficacy? c) What is the approximate Kd of capsaicin in uM? (you can round to the nearest power of 10)arrow_forwardWhat is the rate-limiting-step for serotonin synthesis?arrow_forwardWhat enzyme is necessary for synthesis of all of the monoamines?arrow_forward
 Case Studies In Health Information ManagementBiologyISBN:9781337676908Author:SCHNERINGPublisher:Cengage
 Biology (MindTap Course List)BiologyISBN:9781337392938Author:Eldra Solomon, Charles Martin, Diana W. Martin, Linda R. BergPublisher:Cengage Learning
 Concepts of BiologyBiologyISBN:9781938168116Author:Samantha Fowler, Rebecca Roush, James WisePublisher:OpenStax College
 Biology 2eBiologyISBN:9781947172517Author:Matthew Douglas, Jung Choi, Mary Ann ClarkPublisher:OpenStax
 Principles Of Radiographic Imaging: An Art And A ...Health & NutritionISBN:9781337711067Author:Richard R. Carlton, Arlene M. Adler, Vesna BalacPublisher:Cengage Learning