LIFE: THE SCIENCE OF BIOLOGY
11th Edition
ISBN: 9781319145125
Author: Sadava
Publisher: MAC HIGHER
expand_more
expand_more
format_list_bulleted
Concept explainers
Videos
Question
Chapter 35, Problem 2Q
Summary Introduction
To analyze:
The data about the mass and number of seeds generated by the barley plants of third generation i.e. presented in the given table and draw out conclusions from the data.
Given:
Three generations of barley were grown in different concentrations of nickel-containing medium. The total seeds from each plant group were harvested and their numbers and masses were examined.
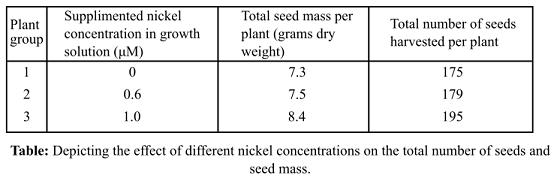
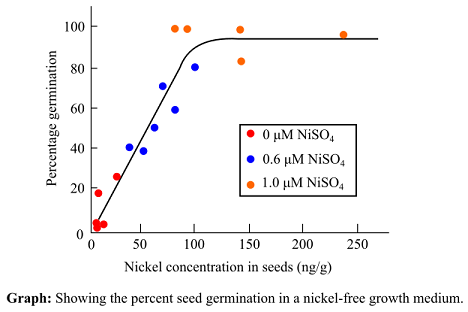
Some of the seeds out of the total harvest were grown in nickel-free conditions to test their germination.
Introduction:
Reproductive success of a plant depends on its seed set. If a plant receives all its nutrients, plant will have a healthy seed set with increased seed size and greater mass.
Expert Solution & Answer
Want to see the full answer?
Check out a sample textbook solution
Students have asked these similar questions
Alleles at the P locus control seed color. Plants which are pp have white seeds, white flowers and no pigment in vegetative parts. Plants which are P_ have black seeds, purple flowers and may have varying degrees of pigment on stems and leaves. Seed color can be assessed, visually, based on if the seed is white or not white
A gene for mold resistance has been reported and we want to determine its inheritance and whether it is linked to P. For the purposes of this exercise, we will assume that resistance is controlled by a single locus M, and M_ plants are resistant and mm plants are susceptible. Resistance can be measured, under greenhouse conditions, 2 weeks after planting, by injecting each seedling with a spore suspension. After two weeks, the seedlings can be rated as resistant or susceptible, based on whether or not tissue is actively sporulating.
For this exercise we will use seed and data from the F10 generation of a recombinant inbred population produced using single seed…
Linkage in common bean
Alleles at the P locus control seed color. Plants which are pp have white seeds, white flowers and no pigment in vegetative parts. Plants which are P_ have black seeds, purple flowers and may have varying degrees of pigment on stems and leaves. Seed color can be assessed, visually, based on if the seed is white or not white
A gene for mold resistance has been reported and we want to determine its inheritance and whether it is linked to P. For the purposes of this exercise, we will assume that resistance is controlled by a single locus M, and M_ plants are resistant and mm plants are susceptible. Resistance can be measured, under greenhouse conditions, 2 weeks after planting, by injecting each seedling with a spore suspension. After two weeks, the seedlings can be rated as resistant or susceptible, based on whether or not tissue is actively sporulating.
For this exercise we will use seed and data from the F10 generation of a recombinant inbred population…
Alleles at the P locus control seed color. Plants which are pp have white seeds, white flowers and no pigment in vegetative parts. Plants which are P_ have black seeds, purple flowers and may have varying degrees of pigment on stems and leaves. Seed color can be assessed, visually, based on if the seed is white or not white
A gene for mold resistance has been reported and we want to determine its inheritance and whether it is linked to P. For the purposes of this exercise, we will assume that resistance is controlled by a single locus M, and M_ plants are resistant and mm plants are susceptible. Resistance can be measured, under greenhouse conditions, 2 weeks after planting, by injecting each seedling with a spore suspension. After two weeks, the seedlings can be rated as resistant or susceptible, based on whether or not tissue is actively sporulating.
For this exercise we will use seed and data from the F10 generation of a recombinant inbred population produced using single seed…
Chapter 35 Solutions
LIFE: THE SCIENCE OF BIOLOGY
Knowledge Booster


Learn more about
Need a deep-dive on the concept behind this application? Look no further. Learn more about this topic, biology and related others by exploring similar questions and additional content below.Similar questions
- can you help? I think its B but not surearrow_forwardSkip to main content close Homework Help is Here – Start Your Trial Now! arrow_forward search SEARCH ASK Human Anatomy & Physiology (11th Edition)BUY Human Anatomy & Physiology (11th Edition) 11th Edition ISBN: 9780134580999 Author: Elaine N. Marieb, Katja N. Hoehn Publisher: PEARSON 1 The Human Body: An Orientation expand_moreChapter 1 : The Human Body: An Orientation Chapter Questions expand_moreSection: Chapter Questions Problem 1RQ: The correct sequence of levels forming the structural hierarchy is A. (a) organ, organ system,... format_list_bulletedProblem 1RQ: The correct sequence of levels forming the structural hierarchy is A. (a) organ, organ system,... See similar textbooks Bartleby Related Questions Icon Related questions Bartleby Expand Icon bartleby Concept explainers bartleby Question Draw a replication bubble with two replication forks.blue lines are DNA single strands and red lines are RNA single strands.indicate all 3' and 5’ ends on all DNA single…arrow_forwardProvide an answerarrow_forward
- Question 4 1 pts Which of the following would be most helpful for demonstrating alternative splicing for a new organism? ○ its proteome and its transcriptome only its transcriptome only its genome its proteome and its genomearrow_forwardIf the metabolic scenario stated with 100 mM of a sucrose solution, how much ATP would be made then during fermentation?arrow_forwardWhat is agricuarrow_forward
- When using the concept of "a calorie in is equal to a calorie out" how important is the quality of the calories?arrow_forwardWhat did the Cre-lox system used in the Kikuchi et al. 2010 heart regeneration experiment allow researchers to investigate? What was the purpose of the cmlc2 promoter? What is CreER and why was it used in this experiment? If constitutively active Cre was driven by the cmlc2 promoter, rather than an inducible CreER system, what color would you expect new cardiomyocytes in the regenerated area to be no matter what? Why?arrow_forwardWhat kind of organ size regulation is occurring when you graft multiple organs into a mouse and the graft weight stays the same?arrow_forward
- What is the concept "calories consumed must equal calories burned" in regrads to nutrition?arrow_forwardYou intend to insert patched dominant negative DNA into the left half of the neural tube of a chick. 1) Which side of the neural tube would you put the positive electrode to ensure that the DNA ends up on the left side? 2) What would be the internal (within the embryo) control for this experiment? 3) How can you be sure that the electroporation method itself is not impacting the embryo? 4) What would you do to ensure that the electroporation is working? How can you tell?arrow_forwardDescribe a method to document the diffusion path and gradient of Sonic Hedgehog through the chicken embryo. If modifying the protein, what is one thing you have to consider in regards to maintaining the protein’s function?arrow_forward
arrow_back_ios
SEE MORE QUESTIONS
arrow_forward_ios
Recommended textbooks for you
 Biology (MindTap Course List)BiologyISBN:9781337392938Author:Eldra Solomon, Charles Martin, Diana W. Martin, Linda R. BergPublisher:Cengage Learning
 Case Studies In Health Information ManagementBiologyISBN:9781337676908Author:SCHNERINGPublisher:Cengage
Biology (MindTap Course List)
Biology
ISBN:9781337392938
Author:Eldra Solomon, Charles Martin, Diana W. Martin, Linda R. Berg
Publisher:Cengage Learning
Case Studies In Health Information Management
Biology
ISBN:9781337676908
Author:SCHNERING
Publisher:Cengage
General Embryology Review in 20 minutes; Author: Medical Animations;https://www.youtube.com/watch?v=4YKvVeVMmEE;License: Standard youtube license