
Concept explainers
Videos
A very large batch of components has arrived at a distributor. The batch can be characterized as accept-able only if the proportion of defective components is at most .10. The distributor decides to randomly select 10 components and to accept the batch only if the number of defective components in the sample is at most 2.
- a. What is the
probability that the batch will be accepted when the actual proportion of defectives is .01? .05? .10? .20? .25? - b. Let p denote the actual proportion of defectives in the batch. A graph of P(batch is accepted) as a
function of p, with p on the horizontal axis and P(batch is accepted) on the vertical axis, is called the operating characteristic curve for the acceptance sampling plan. Use the results of part (a) to sketch this curve for 0 ≤ p ≤ 1. - c. Repeat parts (a) and (b) with “1” replacing “2” in the acceptance sampling plan.
- d. Repeat parts (a) and (b) with “15” replacing “10” in the acceptance sampling plan.
- e. Which of the three sampling plans, that of part (a), (c), or (d), appears most satisfactory, and why?
a.
Find the probability that the batch will be accepted when the actual proportion of defectives is 0.01, 0.05, 0.10, 0.20 and 0.25.
Answer to Problem 58E
The probability that the batch will be accepted for different values of actual proportion of defectives, are,
| p | |
| 0.01 | 0.998 |
| 0.05 | 0.9885 |
| 0.1 | 0.9298 |
| 0.20 | 0.6778 |
| 0.25 | 0.5256 |
Explanation of Solution
Given info:
A distributor decided to select 10 components randomly from a batch. The batch will be accepted if the number of defective components in the sample is at most 2. A batch is characterized as acceptable if the proportion of defective components is at most 0.10.
Calculation:
Let p be the actual proportion of defective in the batch.
Let X be the number of defectives in the sample.
The sample size is 10. The samples are selected randomly and the outcomes are defective or non-defective.
Hence,
It is given that the batch will be accepted if the number of defective components in the sample is at most 2 means the batch will be accepted if
The probability that the batch will be accepted when the actual proportion of defectives is p, is
The probability values:
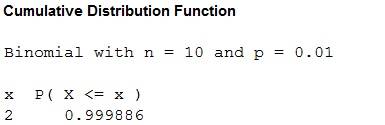
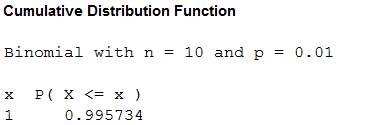
For p = 0.01:
Software procedure:
Step by step procedure to obtain the probability values using the MINITAB software:
- Choose Calc > Probability Distribution> Binomial Distribution.
- Enter number of trials as 10 and event probability as 0.01.
- Choose Cumulative probability.
- In Input constant, enter 2.
- Click OK.
Output using MINITAB software is given below:
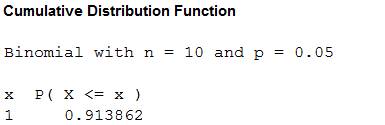
For p = 0.05:
Software procedure:
Step by step procedure to obtain the probability values using the MINITAB software:
- Choose Calc > Probability Distribution> Binomial Distribution.
- Enter number of trials as 10 and event probability as 0.05
- Choose Cumulative probability.
- In Input constant, enter 2.
- Click OK.
Output using MINITAB software is given below:

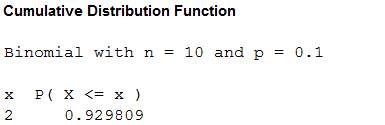
For p = 0.10:
Software procedure:
Step by step procedure to obtain the probability values using the MINITAB software:
- Choose Calc > Probability Distribution> Binomial Distribution.
- Enter number of trials as 10 and event probability as 0.10
- Choose Cumulative probability.
- In Input constant, enter 2.
- Click OK.
Output using MINITAB software is given below:
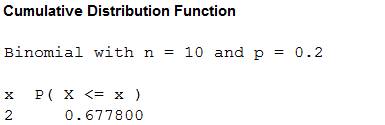
For p = 0.2:
Software procedure:
Step by step procedure to obtain the probability values using the MINITAB software:
- Choose Calc > Probability Distribution> Binomial Distribution.
- Enter number of trials as 10 and event probability as 0.20
- Choose Cumulative probability.
- In Input constant, enter 2.
- Click OK.
Output using MINITAB software is given below:
For p = 0.25:
Software procedure:
Step by step procedure to obtain the probability values using the MINITAB software:
- Choose Calc > Probability Distribution> Binomial Distribution.
- Enter number of trials as 10 and event probability as 0.25
- Choose Cumulative probability.
- In Input constant, enter 2.
- Click OK.
Output using MINITAB software is given below:
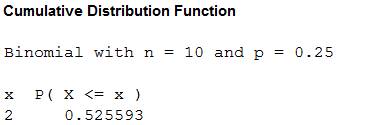
Hence, the probability that the batch will be accepted for different values of actual proportion of defectives and for
| p | |
| 0.01 | 0.998 |
| 0.05 | 0.9885 |
| 0.1 | 0.9298 |
| 0.20 | 0.6778 |
| 0.25 | 0.5256 |
b.
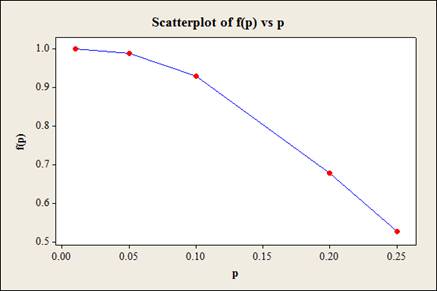
Sketch the OC curve for the accepting sampling plan.
Answer to Problem 58E
The graph is given below:
Explanation of Solution
Calculation:
From part (a) it is found that, the probability that the batch will be accepted for different values of actual proportion of defectives, are,
| p | |
| 0.01 | 0.998 |
| 0.05 | 0.9885 |
| 0.1 | 0.9298 |
| 0.20 | 0.6778 |
| 0.25 | 0.5256 |
Software procedure:
Step by step procedure to obtain the probability values using the MINITAB software:
- Choose Graph > Scatterplot.
- Choose With Connect Line, and then click OK.
- Under Y variables, enter a column of f(p).
- Under X variables, enter a column of p.
- Click OK.
Output using MINITAB software is given below:
c.
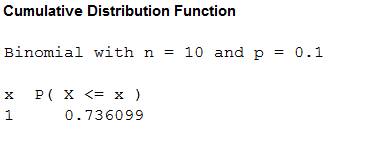
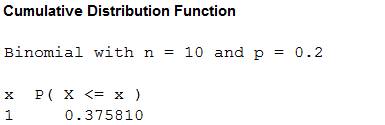
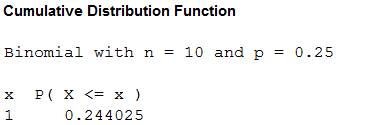
Find the probability that the batch will be accepted when the actual proportion of defectives is 0.01, 0.05, 0.10, 0.20 and 0.25 with “1” replacing “2”.
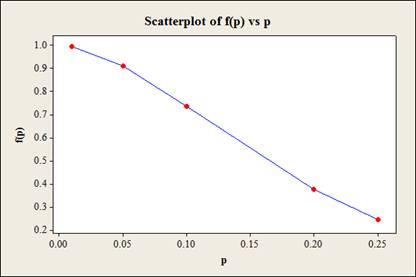
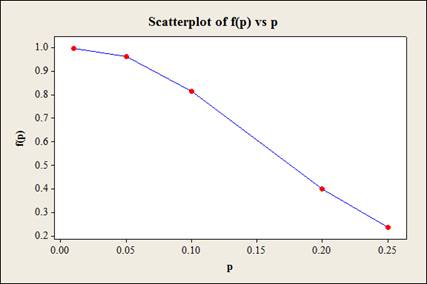
Sketch the OC curve for the accepting sampling plan.
Answer to Problem 58E
The probability that the batch will be accepted when the actual proportion of defectives is 0.01, 0.05, 0.10, 0.20 and 0.25 are 0.9957, 0.9138, 0.7360, 0.3758, and 0.2440 respectively.
The OC curve is given below
Explanation of Solution
Given info:
The c value 2 is replaced by 1.
Calculation:
Let p be the actual proportion of defective in the batch.
Let X be the number of defectives in the sample.
The sample size is 10. The samples are selected randomly and the outcomes are defective or non-defective.
Hence,
It is given that the batch will be accepted if the number of defective components in the sample is at most 1 means the batch will be accepted if
The probability that the batch will be accepted when the actual proportion of defectives is p, is
The probability values:
For p = 0.01:
Software procedure:
Step by step procedure to obtain the probability values using the MINITAB software:
- Choose Calc > Probability Distribution> Binomial Distribution.
- Enter number of trials as 10 and event probability as 0.01
- Choose Cumulative probability.
- In Input constant, enter 1.
- Click OK.
Output using MINITAB software is given below:
For p = 0.05:
Software procedure:
Step by step procedure to obtain the probability values using the MINITAB software:
- Choose Calc > Probability Distribution> Binomial Distribution.
- Enter number of trials as 10 and event probability as 0.05
- Choose Cumulative probability.
- In Input constant, enter 1.
- Click OK.
Output using MINITAB software is given below:
For p = 0.10:
Software procedure:
Step by step procedure to obtain the probability values using the MINITAB software:
- Choose Calc > Probability Distribution> Binomial Distribution.
- Enter number of trials as 10 and event probability as 0.10
- Choose Cumulative probability.
- In Input constant, enter 1.
- Click OK.
Output using MINITAB software is given below:
For p = 0.2:
Software procedure:
Step by step procedure to obtain the probability values using the MINITAB software:
- Choose Calc > Probability Distribution> Binomial Distribution.
- Enter number of trials as 10 and event probability as 0.20
- Choose Cumulative probability.
- In Input constant, enter 1.
- Click OK.
Output using MINITAB software is given below:
For p = 0.25:
Software procedure:
Step by step procedure to obtain the probability values using the MINITAB software:
- Choose Calc > Probability Distribution> Binomial Distribution.
- Enter number of trials as 10 and event probability as 0.25.
- Choose Cumulative probability.
- In Input constant, enter 1.
- Click OK.
Output using MINITAB software is given below:
Thus, the probability that the batch will be accepted for different values of actual proportion of defectives,
| p | |
| 0.01 | 0.9957 |
| 0.05 | 0.9138 |
| 0.1 | 0.7360 |
| 0.20 | 0.3758 |
| 0.25 | 0.2440 |
OC curve:
Software procedure:
Step by step procedure to obtain the probability values using the MINITAB software:
- Choose Graph > Scatterplot.
- Choose With Connect Line, and then click OK.
- Under Y variables, enter a column of f(p).
- Under X variables, enter a column of p.
- Click OK.
Output using MINITAB software is given below:

d.
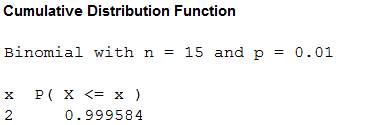
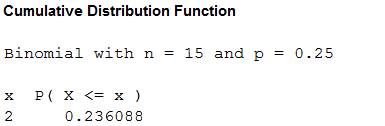
Find the probability that the batch will be accepted when the actual proportion of defectives is 0.01, 0.05, 0.10, 0.20 and 0.25 with “15” replacing “10”.
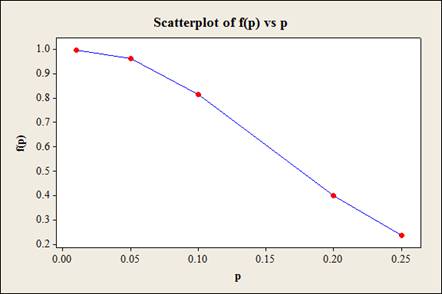
Sketch the OC curve for the accepting sampling plan.
Answer to Problem 58E
The probability that the batch will be accepted for different values of actual proportion of defectives,
| p | |
| 0.01 | 0.996 |
| 0.05 | 0.9638 |
| 0.1 | 0.8159 |
| 0.20 | 0.3980 |
| 0.25 | 0.2360 |
The OC curve is given below
Explanation of Solution
Given info:
10 is replaced by 15.
Calculation:
Let p be the actual proportion of defective in the batch.
Let X be the number of defectives in the sample.
The sample size is 15. The samples are selected randomly and the outcomes are defective or non-defective.
Hence,
It is given that the batch will be accepted if the number of defective components in the sample is at most 2 means the batch will be accepted if
The probability that the batch will be accepted when the actual proportion of defectives is p, is
The probability values:
For p = 0.01:
Software procedure:
Step by step procedure to obtain the probability values using the MINITAB software:
- Choose Calc > Probability Distribution> Binomial Distribution.
- Enter number of trials as 15 and event probability as 0.01
- Choose Cumulative probability.
- In Input constant, enter 2.
- Click OK.
Output using MINITAB software is given below:
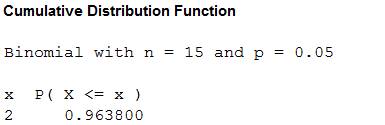
For p = 0.05:
Software procedure:
Step by step procedure to obtain the probability values using the MINITAB software:
- Choose Calc > Probability Distribution> Binomial Distribution.
- Enter number of trials as 15 and event probability as 0.05
- Choose Cumulative probability.
- In Input constant, enter 2.
- Click OK.
Output using MINITAB software is given below:
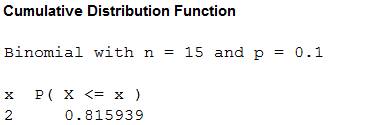
For p = 0.10:
Software procedure:
Step by step procedure to obtain the probability values using the MINITAB software:
- Choose Calc > Probability Distribution> Binomial Distribution.
- Enter number of trials as 15 and event probability as 0.10
- Choose Cumulative probability.
- In Input constant, enter 2.
- Click OK.
Output using MINITAB software is given below:
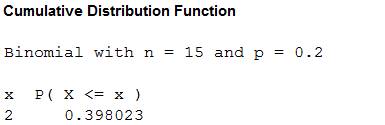
For p = 0.2:
Software procedure:
Step by step procedure to obtain the probability values using the MINITAB software:
- Choose Calc > Probability Distribution> Binomial Distribution.
- Enter number of trials as 15 and event probability as 0.20
- Choose Cumulative probability.
- In Input constant, enter 2.
- Click OK.
Output using MINITAB software is given below:
For p = 0.25:
Software procedure:
Step by step procedure to obtain the probability values using the MINITAB software:
- Choose Calc > Probability Distribution> Binomial Distribution.
- Enter number of trials as 15 and event probability as 0.25
- Choose Cumulative probability.
- In Input constant, enter 2.
- Click OK.
Output using MINITAB software is given below:
Hence, the probability that the batch will be accepted for different values of actual proportion of defectives,
| p | |
| 0.01 | 0.996 |
| 0.05 | 0.9638 |
| 0.1 | 0.8159 |
| 0.20 | 0.3980 |
| 0.25 | 0.2360 |
OC curve:
Software procedure:
Step by step procedure to obtain the probability values using the MINITAB software:
- Choose Graph > Scatterplot.
- Choose With Connect Line, and then click OK.
- Under Y variables, enter a column of f(p).
- Under X variables, enter a column of p.
- Click OK.
Output using MINITAB software is given below:
e.
Find the most satisfactory sampling plan among a, c and d.
Answer to Problem 58E
Plan in part (d) is most satisfactory.
Explanation of Solution
Justification:
It is known that a batch is characterized as acceptable if the proportion of defective components is at most 0.10 that is
Hence, the desirable probability of accepting a batch should be high when
Comparing the three sampling plan, it can be observed that for p = 0.25, the probability of accepting a batch is lowest for sampling plan in part (d) and for p = 0.01, the probability of accepting a batch is highest for sampling plan in part (d).
Hence, the sampling plan in part (d) is most satisfactory.
Want to see more full solutions like this?
Chapter 3 Solutions
Probability and Statistics for Engineering and the Sciences STAT 400 - University Of Maryland


- Let X be a continuous RV with PDF where a > 0 and 0 > 0 are parameters. verify that f-∞ /x (x)dx = 1. Find the CDF, Fx (7), of X.arrow_forward6. [20] Let X be a continuous RV with PDF 2(1), 1≤x≤2 fx(x) = 0, otherwisearrow_forwardA survey of 581 citizens found that 313 of them favor a new bill introduced by the city. We want to find a 95% confidence interval for the true proportion of the population who favor the bill. What is the lower limit of the interval? Enter the result as a decimal rounded to 3 decimal digits. Your Answer:arrow_forward
- A survey of 581 citizens found that 313 of them favor a new bill introduced by the city. We want to find a 95% confidence interval for the true proportion of the population who favor the bill. What is the lower limit of the interval? Enter the result as a decimal rounded to 3 decimal digits. Your Answer:arrow_forward2. The SMSA data consisting of 141 observations on 10 variables is fitted by the model below: 1 y = Bo+B1x4 + ẞ2x6 + ẞ3x8 + √1X4X8 + V2X6X8 + €. See Question 2, Tutorial 3 for the meaning of the variables in the above model. The following results are obtained: Estimate Std. Error t value Pr(>|t|) (Intercept) 1.302e+03 4.320e+02 3.015 0.00307 x4 x6 x8 x4:x8 x6:x8 -1.442e+02 2.056e+01 -7.013 1.02e-10 6.340e-01 6.099e+00 0.104 0.91737 -9.455e-02 5.802e-02 -1.630 0.10550 2.882e-02 2.589e-03 11.132 1.673e-03 7.215e-04 2.319 F) x4 1 3486722 3486722 17.9286 4.214e-05 x6 1 14595537 x8 x4:x8 x6:x8 1 132.4836 < 2.2e-16 1045693 194478 5.3769 0.02191 1 1198603043 1198603043 6163.1900 < 2.2e-16 1 25765100 25765100 1045693 Residuals 135 26254490 Estimated variance matrix (Intercept) x4 x6 x8 x4:x8 x6:x8 (Intercept) x4 x6 x8 x4:x8 x6:x8 0.18875694 1.866030e+05 -5.931735e+03 -2.322825e+03 -16.25142055 0.57188953 -5.931735e+03 4.228816e+02 3.160915e+01 0.61621781 -0.03608028 -0.00445013 -2.322825e+03…arrow_forwardIn some applications the distribution of a discrete RV, X resembles the Poisson distribution except that 0 is not a possible value of X. Consider such a RV with PMF where 1 > 0 is a parameter, and c is a constant. (a) Find the expression of c in terms of 1. (b) Find E(X). (Hint: You can use the fact that, if Y ~ Poisson(1), the E(Y) = 1.)arrow_forward
- Suppose that X ~Bin(n,p). Show that E[(1 - p)] = (1-p²)".arrow_forwardI need help with this problem and an explanation of the solution for the image described below. (Statistics: Engineering Probabilities)arrow_forwardI need help with this problem and an explanation of the solution for the image described below. (Statistics: Engineering Probabilities)arrow_forward
- This exercise is based on the following data on four bodybuilding supplements. (Figures shown correspond to a single serving.) Creatine(grams) L-Glutamine(grams) BCAAs(grams) Cost($) Xtend(SciVation) 0 2.5 7 1.00 Gainz(MP Hardcore) 2 3 6 1.10 Strongevity(Bill Phillips) 2.5 1 0 1.20 Muscle Physique(EAS) 2 2 0 1.00 Your personal trainer suggests that you supplement with at least 10 grams of creatine, 39 grams of L-glutamine, and 90 grams of BCAAs each week. You are thinking of combining Xtend and Gainz to provide you with the required nutrients. How many servings of each should you combine to obtain a week's supply that meets your trainer's specifications at the least cost? (If an answer does not exist, enter DNE.) servings of xtend servings of gainzarrow_forwardI need help with this problem and an explanation of the solution for the image described below. (Statistics: Engineering Probabilities)arrow_forwardI need help with this problem and an explanation of the solution for the image described below. (Statistics: Engineering Probabilities)arrow_forward

 Holt Mcdougal Larson Pre-algebra: Student Edition...AlgebraISBN:9780547587776Author:HOLT MCDOUGALPublisher:HOLT MCDOUGAL
 College Algebra (MindTap Course List)AlgebraISBN:9781305652231Author:R. David Gustafson, Jeff HughesPublisher:Cengage Learning
 Algebra and Trigonometry (MindTap Course List)AlgebraISBN:9781305071742Author:James Stewart, Lothar Redlin, Saleem WatsonPublisher:Cengage Learning
 College AlgebraAlgebraISBN:9781305115545Author:James Stewart, Lothar Redlin, Saleem WatsonPublisher:Cengage Learning
 Algebra & Trigonometry with Analytic GeometryAlgebraISBN:9781133382119Author:SwokowskiPublisher:Cengage