Campbell Biology: Concepts & Connections, Books a la Carte Plus Mastering Biology with eText -- Access Card Package (8th Edition)
8th Edition
ISBN: 9780133909029
Author: Jane B. Reece, Martha R. Taylor, Eric J. Simon, Jean L. Dickey, Kelly A. Hogan
Publisher: PEARSON
expand_more
expand_more
format_list_bulleted
Concept explainers
Videos
Textbook Question
Chapter 34, Problem 19TYK
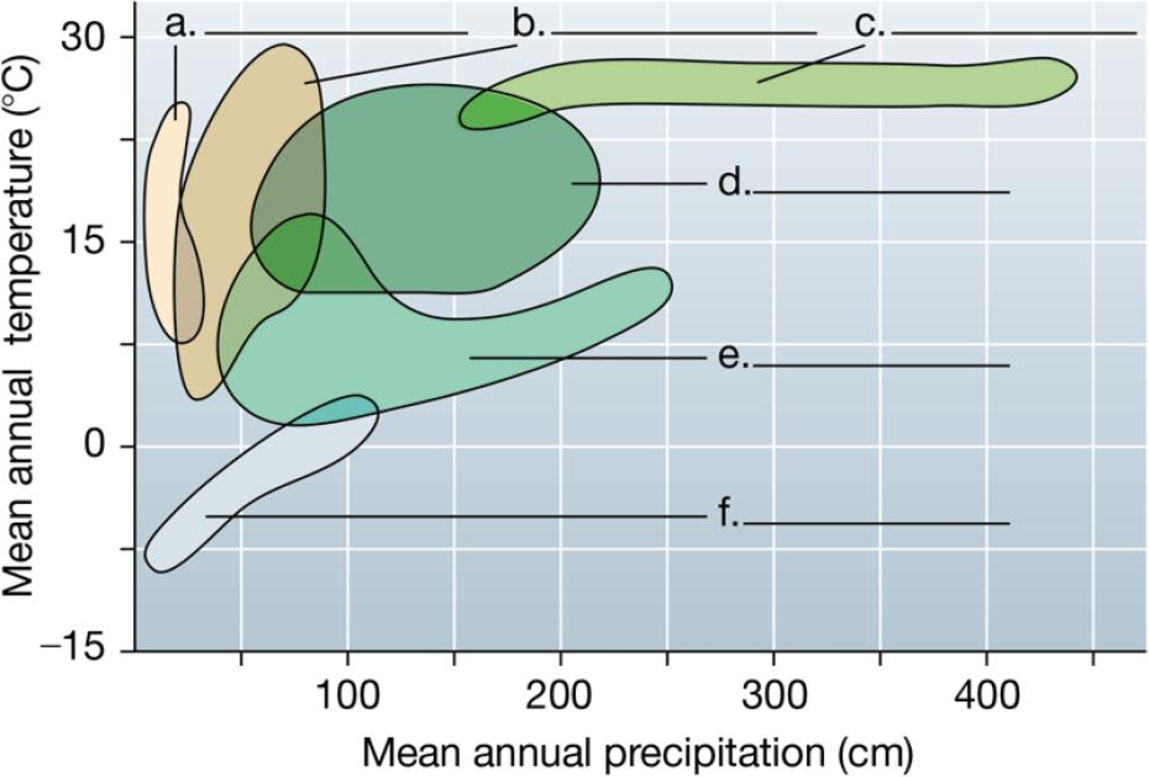
In the climograph below, biomes are plotted by their range of annual mean temperature and annual mean precipitation. Identify the following biomes: arctic tundra, coniferous forest, desert, grassland, temperate forest, and tropical forest. Explain why there are areas in which biomes overlap on this graph.
Expert Solution & Answer
Want to see the full answer?
Check out a sample textbook solution
Students have asked these similar questions
6. The mammalian phylogenies (labeled a and b) were produced by two different research groups.
a. In which tree do phylogenetic relationships most closely align with biogeography and why? (consult the Teeling and Hedges paper)
b. What are the most closely related species to Chiroptera in each tree? Might the use of convergent traits for building phylogenies explain this difference? If so, which tree is most likely to have relied on convergent traits and why?
c. What are some possible reasons that the two research groups came up with different phylogenies (in general terms)? describe at least three possible reasons.
Build a model of a prokaryotic cell using any material of
your choice. In your model be sure to include all the
structures appropriate to your cell. You may model a
bacterial cell or an archaea. You will model at least 4
structures in any model.
Next, build a model of a virus using the same type of
materials. You may choose any type of virus but be sure
you can illustrate the key features of a virus (head shape
for example).
Once complete, take multiple photographs of your models
from all angles. Include these images in a document that
also contains the following completed table format. You
may need to add rows to your table depending on the
type of prokaryote you model.
Structure
Model
Key
Found in
Different in
Function
Virus
Virus
Once your model is complete, write a brief description of
your cell and your virus. Emphasize features that are
absent in viruses that classify them as non-living. You can
refer to specific structures in your table in this
explanation.
Some suggestions for…
(This is a 2-part work, Part 1 is done, only Part 2 is to be worked on at the bottom)Part 1 (Done): Describe the levels of structural hierarchy for the human body, starting with the organismal level and ending with the chemical level. In addition, you should make sure you link each level to the previous level, emphasizing the structural relationships.
The human body is organized into a structural hierarchy that progresses from the macroscopic organismal level down to the microscopic chemical level. Each level builds upon the previous one, creating increasingly complex structures. Below is the hierarchy, from largest to smallest, with explanations linking each level to its predecessor:
1. Organismal Level
The entire living human body.Relationship: All lower levels work together to sustain life at this highest level.
2. Organ System Level
Groups of organs working together to perform major functions.Examples: circulatory, nervous, digestive systems.Relationship: The organismal…
Chapter 34 Solutions
Campbell Biology: Concepts & Connections, Books a la Carte Plus Mastering Biology with eText -- Access Card Package (8th Edition)
Ch. 34 - You have seen that Earths terrestrial biomes...Ch. 34 - The most complex and diverse biome a. chaparral b....Ch. 34 - Ground permanently frozen a. chaparral b. savanna...Ch. 34 - Prob. 4TYKCh. 34 - Limited to small coastal areas a. chaparral b....Ch. 34 - Spruce, fir, pine, and hemlock trees a. chaparral...Ch. 34 - Home of ants, antelopes, and lions a. chaparral b....Ch. 34 - Prob. 8TYKCh. 34 - Prob. 9TYKCh. 34 - What makes the Gobi Desert of Asia a desert? a....
Ch. 34 - Prob. 11TYKCh. 34 - Prob. 12TYKCh. 34 - Phytoplankton are the major photosynthesizers in...Ch. 34 - Prob. 14TYKCh. 34 - Prob. 15TYKCh. 34 - Prob. 16TYKCh. 34 - Prob. 17TYKCh. 34 - Aquatic biomes differ in levels of light,...Ch. 34 - In the climograph below, biomes are plotted by...Ch. 34 - Prob. 20TYKCh. 34 - SCIENTIFIC THINKING In 1954, workers at Michigan...
Knowledge Booster


Learn more about
Need a deep-dive on the concept behind this application? Look no further. Learn more about this topic, biology and related others by exploring similar questions and additional content below.Similar questions
- Describe the levels of structural hierarchy for the human body, starting with the organismal level and ending with the chemical level. In addition, you should make sure you link each level to the previous level, emphasizing the structural relationships.arrow_forward9 S es Read the section "Investigating Life: In (Extremely) Cold Blood." Then, drag and drop the terms on the left to complete the concept map. Red blood cells Genes Icefishes -have mutated have colorless Oxygen have few lack encode Blood Cellular respiration consists of- contain carries is a Platelets White blood cells carries low amounts of Hemoglobin is necessary for Plasma Protein Reset.arrow_forwardPlating 50 microliters of a sample diluted by a factor of 10-6 produced 91 colonies. What was the originalcell density (CFU/ml) in the sample?arrow_forward
- Every tutor here has got this wrong, don't copy off them.arrow_forwardSuppose that the population from question #1 (data is in table below) is experiencing inbreeding depression (F=.25) (and no longer experiencing natural selection). Calculate the new expected genotype frequencies (f) in this population after one round of inbreeding. Please round to 3 decimal places. Genotype Adh Adh Number of Flies 595 Adh Adh 310 Adhs Adhs 95 Total 1000 fladh Adh- flAdn Adh fAdhs Adharrow_forwardWhich of the following best describes why it is difficult to develop antiviral drugs? Explain why. A. antiviral drugs are very difficult to develop andhave no side effects B. viruses are difficult to target because they usethe host cell’s enzymes and ribosomes tometabolize and replicate C. viruses are too small to be targeted by drugs D. viral infections usually clear up on their ownwith no problemsarrow_forward
- This question has 3 parts (A, B, & C), and is under the subject of Nutrition. Thank you!arrow_forwardThey got this question wrong the 2 previous times I uploaded it here, please make sure it's correvct this time.arrow_forwardThis question has multiple parts (A, B & C), and under the subject of Nutrition. Thank you!arrow_forward
- Calculate the CFU/ml of a urine sample if 138 E. coli colonies were counted on a Nutrient Agar Plate when0.5 mls were plated on the NA plate from a 10-9 dilution tube. You must highlight and express your answerin scientific notatioarrow_forwardDon't copy off the other answer if there is anyarrow_forwardAnswerarrow_forward
arrow_back_ios
SEE MORE QUESTIONS
arrow_forward_ios
Recommended textbooks for you
 Concepts of BiologyBiologyISBN:9781938168116Author:Samantha Fowler, Rebecca Roush, James WisePublisher:OpenStax College
 Biology: The Dynamic Science (MindTap Course List)BiologyISBN:9781305389892Author:Peter J. Russell, Paul E. Hertz, Beverly McMillanPublisher:Cengage Learning
 Biology 2eBiologyISBN:9781947172517Author:Matthew Douglas, Jung Choi, Mary Ann ClarkPublisher:OpenStax
 Biology (MindTap Course List)BiologyISBN:9781337392938Author:Eldra Solomon, Charles Martin, Diana W. Martin, Linda R. BergPublisher:Cengage Learning
 Human Biology (MindTap Course List)BiologyISBN:9781305112100Author:Cecie Starr, Beverly McMillanPublisher:Cengage Learning
 Biology Today and Tomorrow without Physiology (Mi...BiologyISBN:9781305117396Author:Cecie Starr, Christine Evers, Lisa StarrPublisher:Cengage Learning
Concepts of Biology
Biology
ISBN:9781938168116
Author:Samantha Fowler, Rebecca Roush, James Wise
Publisher:OpenStax College
Biology: The Dynamic Science (MindTap Course List)
Biology
ISBN:9781305389892
Author:Peter J. Russell, Paul E. Hertz, Beverly McMillan
Publisher:Cengage Learning
Biology 2e
Biology
ISBN:9781947172517
Author:Matthew Douglas, Jung Choi, Mary Ann Clark
Publisher:OpenStax
Biology (MindTap Course List)
Biology
ISBN:9781337392938
Author:Eldra Solomon, Charles Martin, Diana W. Martin, Linda R. Berg
Publisher:Cengage Learning
Human Biology (MindTap Course List)
Biology
ISBN:9781305112100
Author:Cecie Starr, Beverly McMillan
Publisher:Cengage Learning
Biology Today and Tomorrow without Physiology (Mi...
Biology
ISBN:9781305117396
Author:Cecie Starr, Christine Evers, Lisa Starr
Publisher:Cengage Learning
DIVERSITY IN PLANTS; Author: 7activestudio;https://www.youtube.com/watch?v=uJrks56FQIY;License: Standard YouTube License, CC-BY
Biology- Plant Kingdom - Diversity in Living Organisms - Part 4 - English - English; Author: Bodhaguru;https://www.youtube.com/watch?v=QFgQ74EvfDQ;License: Standard YouTube License, CC-BY