Sub part (a):
Impact of different views on inflation on the economy's equilibrium.
Sub part (a):
Explanation of Solution
The supply is dependent upon the
The demand comes from all the economic agents such as the households, firms, and the government. The demand depends on the price level of the economy. The increase and decrease in the price level determine the level of demand in the economy. The aggregation of all the individual demands in the economy is known as the aggregate demand; thus, the aggregate demand explains the relationship between the general price level and the level of real
When the new chairman is one with the view that the inflation is not a big issue on the economy, the economy would identify the chairman as the silent supporter of the inflation, and they will expect that the chairman will not introduce the active policies to fight against and control the inflation in the economy. As a result, the public will expect that the rise in the inflation and the price level are likely to rise.
Concept introduction:
Aggregate demand curve: It is the curve that shows the relationship between the price level in the economy and the quantity of real GDP demanded by the economic agents such as the households, firms, and the government.
Equilibrium: The equilibrium in the economy is the point where the economy's aggregate demand curve and the aggregate supply curve intersect with each other. There will be no excess demand or
Sub part (b):
Impact of different views on inflation on the economy's equilibrium.
Sub part (b):
Explanation of Solution
When the people expect higher inflation for the next year, they will start to calculate the changes in the price level. According to the expected higher level of inflation over the next year, they will expect higher cost of living for the next year. As a result of this, they will demand higher nominal wage rate for the next year with the employers.
Concept introduction:
Aggregate demand curve: It is the curve that shows the relationship between the price level in the economy and the quantity of real GDP demanded by the economic agents such as the households, firms, and the government.
Aggregate supply curve: In the short run, it is a curve that shows the relationship between the price level in the economy and the supply in the economy by the firms. In the long run, it shows the relationship between the price level and the level of quantity supplied by the firms.
Equilibrium: The equilibrium in the economy is the point where the economy's aggregate demand curve and the aggregate supply curve intersect with each other. There will be no excess demand or excess supply in the economy at the equilibrium.
Sub part (c):
Impact of different views on inflation on the economy's equilibrium.
Sub part (c):
Explanation of Solution
The profit of the firm is the difference between the total cost and the total revenue of the firm's products. When the total cost is higher than the total revenue, the firm faces the loss and if it is vice versa, the firm earns the profit. When the nominal wages increase, it increases the cost of production. So at any given price point, the increase in the labor cost reduces the profitability of the firm because it increases the total cost of production of the firm.
Concept introduction:
Aggregate demand curve: It is the curve that shows the relationship between the price level in the economy and the quantity of real GDP demanded by the economic agents such as the households, firms, and the government.
Aggregate supply curve: In the short run, it is a curve that shows the relationship between the price level in the economy and the supply in the economy by the firms. In the long run, it shows the relationship between the price level and the level of quantity supplied by the firms.
Equilibrium: The equilibrium in the economy is the point where the economy's aggregate demand curve and the aggregate supply curve intersect with each other. There will be no excess demand or excess supply in the economy at the equilibrium.
Sub part (d):
Impact of different views on inflation on the economy's equilibrium.
Sub part (d):
Explanation of Solution
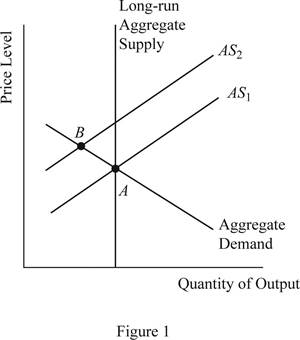
When the profitability of the firm decreases due to the increased nominal wage rate of the labor, the supply will decline in the economy, which will cause the short run aggregate supply curve to shift upward and this can be illustrated on the graph as follows:
Concept introduction:
Aggregate demand curve: It is the curve that shows the relationship between the price level in the economy and the quantity of real GDP demanded by the economic agents such as the households, firms, and the government.
Aggregate supply curve: In the short run, it is a curve that shows the relationship between the price level in the economy and the supply in the economy by the firms. In the long run, it shows the relationship between the price level and the level of quantity supplied by the firms.
Equilibrium: The equilibrium in the economy is the point where the economy's aggregate demand curve and the aggregate supply curve intersect with each other. There will be no excess demand or excess supply in the economy at the equilibrium.
Sub part (e):
Impact of different views on inflation on the economy's equilibrium.
Sub part (e):
Explanation of Solution
When the aggregate demand is held constant without any change and the aggregate supply shifts to AS2 as given above, it will lead to lower output in the economy along with higher price level in the economy. This is because when the SRAS curve shifts upward, the new equilibrium will be derived at point B, which is lying above and leftward to the initial equilibrium point A.
Concept introduction:
Aggregate demand curve: It is the curve that shows the relationship between the price level in the economy and the quantity of real GDP demanded by the economic agents such as the households, firms, and the government.
Aggregate supply curve: In the short run, it is a curve that shows the relationship between the price level in the economy and the supply in the economy by the firms. In the long run, it shows the relationship between the price level and the level of quantity supplied by the firms.
Equilibrium: The equilibrium in the economy is the point where the economy's aggregate demand curve and the aggregate supply curve intersect with each other. There will be no excess demand or excess supply in the economy at the equilibrium.
Sub part (f):
Impact of different views on inflation on the economy's equilibrium.
Sub part (f):
Explanation of Solution
The situation explained above that the total output of the economy falls, whereas the price level in the economy increases leading to the situation of stagflation and this means that the appointment choice of the new chairman was not a wise choice.
Concept introduction:
Aggregate demand curve: It is the curve that shows the relationship between the price level in the economy and the quantity of real GDP demanded by the economic agents such as the households, firms, and the government.
Aggregate supply curve: In the short run, it is a curve that shows the relationship between the price level in the economy and the supply in the economy by the firms. In the long run, it shows the relationship between the price level and the level of quantity supplied by the firms.
Equilibrium: The equilibrium in the economy is the point where the economy's aggregate demand curve and the aggregate supply curve intersect with each other. There will be no excess demand or excess supply in the economy at the equilibrium.
Want to see more full solutions like this?
Chapter 33 Solutions
Principles of Economics

- Assume the United States is a large consumer of steel, able to influence the world price. DUS and SUS denote its demand and supply schedules in Figure 1. The overall (United States plus world) supply schedule of steel is denoted by SUS.+W. Figure 1 Import Tariff Levied by a Large Country Answer all questions (a-f) by referring to Figure 1 above. a) Calculate the free trade market equilibrium price, domestic consumption, and volumE Answer all questions (a-f) by referring to Figure 1 above. a) Calculate the free trade market equilibrium price, domestic consumption, and volume of steel imports by the US. [5 marks] b) Suppose the United States imposes a tariff (t) of $100 on each ton of steel imported. With the tariff, calculate the price of steel and the volume of steel imports by the US. [5 marks] c) Of the $100 tariff, how much is passed on to the US consumer via a higher price, and how much is borne by the foreign exporter? [5 marks] d) Calculate the tariff's deadweight welfare loss to…arrow_forward1. A doctor quits his job, which pays $77,000 per annum, to open a non-governmental organization (NGO) to serve the needs of orphans. His annual expenses for the NGO amounts to $62,700 for food and daily supplies, $9,400 for maintenance, and $1,800 for books. What is his opportunity cost of opening the NGO? (Show working) 2. During the COVID-19 pandemic, hospitals worldwide faced severe resource constraints, including: a. Limited ICU beds b. Shortage of ventilators c. Insufficient doctors and nurses d. Lack of vaccines in early 2021 Governments and hospitals had to make critical decisions about who receives treatment first and how to allocate limited resources efficiently. In no more than 150 words and using core economic concepts of scarcity, choice and opportunity cost, how would you help your government make these critical decisions?arrow_forwardWhat is the argument about necessary evil?arrow_forward
- What are the consequences of declining houses prices?arrow_forwardQ1 Explain what economic catch 22 is. Q2 What are the consequences of declining houses pricing? Q3 What is the argument about necessary evil? Q4 Explain the idea of irrational exhuberance? Q5 Explain what was the economic paradox?arrow_forward< Files 9:10 Fri Mar 21 Chapter+11-Public+Goods+and+Common+Res... The Economic Catch-22 By Robert J. Samuelson We are now in the "blame phase" of the economic cycle. As the housing slump deepens and financial markets swing erratically, we've embarked on the usual search for culprits. Who got us into this mess? Our investigations will doubtlessly reveal, as they already have, much wishful thinking and miscalculation. They will also find incompetence, predatory behavior and probably some criminality. But let me suggest that, though inevitable and necessary, this exercise is also simplistic and deceptive. -- business It assumes that, absent mistakes and misdeeds, we might remain in a permanent paradise of powerful income and wealth growth. The reality, I think, is that the economy follows its own Catch-22: By taking prosperity for granted, people perversely subvert prosperity. The more we managers, investors, consumers - think that economic growth is guaranteed and that risk and…arrow_forward
- 2.) Using the line drawing tool, plot and label the isocost line. Carefully follow the instructions above, and only draw the required objects. FILL IN BLANK d. Now suppose the price of labour rises to $5 per unit, but the firm still wants to produce 500 tires per day. Explain how a cost-minimizing firm adjusts to this change (with no change in technology). A cost-minimizing firm will be producing on ▼ The samedifferently slopedparallel isocost line. The firm will use ▼ moresameless labour and ▼ less the same amount of more capital and produce on ▼ a higher point on the same a lower point on the same a lower a higher isoquant curve.arrow_forwardQK Using the graph on the right, determine how the firm should change the quantity of the production factors in order to reduce the costs. The firm that is producing at point A can reduce its costs for producing 2000 units by employing A. same capital and more labour. B. less capital and more labour. ○ C. less capital and the same labour. D. more capital and more labour. OE. more capital and less labour. C A B Q =4000 Q = 2000 C Isocost line QLarrow_forwardPL Suppose the price ratio is the same along isocost PK lines A and B. In the figure at right, the difference between isocost line A and isocost line B is that A. the total cost is larger along B. B. the total cost is larger along A. OC. labour is relatively more expensive along A. ○ D. the level of output is lower along A. OE. both capital and labour are relatively cheaper along A. Capital B Labourarrow_forward
- Using the graph on the right, determine the per unit prices of capital and labour. 20- Given the information provided about the isocost lines, we know that the per unit price of capital is TC=$100 and the per unit price of labour is 16- TC $80 ○ A. $50; $20 ○ B. $2; $5 ○ C. $5; $2 ○ D. $20; $50 E. not determinable; not determinable Quantity of K 12 TC $60 TC $40 0 10 20 30 Quantity of L 40arrow_forwardThe diagram to the right contains isocost lines A and B. If the price of capital is the same for both lines, then the difference between isocost line A and isocost line B is that OA. the total cost is larger along B. B. the level of output is lower along A. C. both capital and labour are cheaper along A. OD. labour is more expensive along A. ○ E. labour is more expensive along B. Capital Labourarrow_forwardFor the firm whose cost curves are shown at right, the minimum efficient scale is ○ A. between 60 and 140 units of production. OB. about 20 units of production. OC. about 60 units of production. OD. about 100 units of production. OE. the level of fixed cost corresponding to SRATC2. SRATC₁ LRAC SRATC4 SRATC₂ SRATC3 เนด เad iso C 20 20 40 60 80 100 120 140 160 180 200 Output per Periodarrow_forward
 Macroeconomics: Private and Public Choice (MindTa...EconomicsISBN:9781305506756Author:James D. Gwartney, Richard L. Stroup, Russell S. Sobel, David A. MacphersonPublisher:Cengage Learning
 Economics: Private and Public Choice (MindTap Cou...EconomicsISBN:9781305506725Author:James D. Gwartney, Richard L. Stroup, Russell S. Sobel, David A. MacphersonPublisher:Cengage Learning
 Exploring EconomicsEconomicsISBN:9781544336329Author:Robert L. SextonPublisher:SAGE Publications, Inc
 Economics (MindTap Course List)EconomicsISBN:9781337617383Author:Roger A. ArnoldPublisher:Cengage Learning