Concept explainers
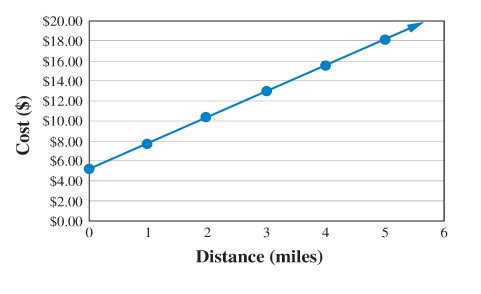
In Lesson 3-1, we studied a cab ride by looking at the price for certain distances in table and graph form. We found that the initial cost of starting the trip was $5.10, which means that you’d pay $5.10 for zero miles traveled. We also found that the slope of the line was $2.60, which means that you’d pay $2.60 per mile. Using what we learned in Lesson 3-2, we can write a formula that describes the cost of a trip (C) in terms of miles traveled (m):
Here’s a smaller version of the graph describing cab rides from Lesson 3-1. Does your answer to Question 2 match the information on the graph? Draw an arrow to the location on the graph that you used to decide.

Want to see the full answer?
Check out a sample textbook solution
Chapter 3 Solutions
PATHWAYS TO MATH LITERACY (LL)W/CONNECT
- 1. Find the inverse of f(x) = = 2x 1+2x Then find the domain of the inverse.arrow_forwardProve for any graph G, δ(G) ≤ d(G) ≤ ∆(G) using the definition of average degree, make a formal proofarrow_forwardRestart box ixl.com/math/grade-6/area-of-compound-figures-with-triangles ass BModules Dashboard | Khan... Grades 6-8 Life S... t Typing Lessons BDashboard f IXL My IXL Learning Assessm Sixth grade >GG.12 Area of compound figures with triangles 5V2 What is the area of this figure? 4 km 2 km 5 km 4 km 2 km Learn with an example 13 km Write your answer using decimals, if necessary. square kilometers Submit Area of compound figures Area of triangles (74) Work it out Not feeling ready yet? Thesarrow_forward
- The diagonals of rhombus ABCD intersect at E. Given that BAC=53 degrees, DE=8, and EC=6 find AEarrow_forwardNot use ai pleasearrow_forward2. [-/4 Points] DETAILS MY NOTES SESSCALCET2 7.3.002. Let S be the solid obtained by rotating the region shown in the figure about the y-axis. (Assume a = 6 and b = 2.) ASK YOUR TEACHER 0 y = a sin(bx²) Sketch a typical approximating shell. y 6 4 2 x π/b y 2 1 x 0.5 1.0 1.5 0.2 0.4 0.6 0.8 1.0 -2 -1 -4arrow_forward
- Determine the volume and the surface area of the shape obtained by rotating the area of the figure about the x-axis and the y-axis.arrow_forwardI'm getting only chatgpt answer that are wrong Plz don't use chatgpt answer will upvote .arrow_forwardFind xyz cordinates of center of gravity given z = 3.47 inarrow_forward
- The graph of f', the derivative of f, is shown in the graph below. If f(-9) = -5, what is the value of f(-1)? y 87 19 6 LO 5 4 3 1 Graph of f' x -10 -9 -8 -7 -6 -5 -4 -3 -2 -1 1 2 3 4 5 6 7 8 9 10 -1 -2 -3 -4 -5 -6 -7 -8 564%arrow_forwardFind the geometric center of shapearrow_forwardLet S = be a set of k vectors in R^, with karrow_forwardarrow_back_iosSEE MORE QUESTIONSarrow_forward_ios

 Holt Mcdougal Larson Pre-algebra: Student Edition...AlgebraISBN:9780547587776Author:HOLT MCDOUGALPublisher:HOLT MCDOUGAL
 Algebra: Structure And Method, Book 1AlgebraISBN:9780395977224Author:Richard G. Brown, Mary P. Dolciani, Robert H. Sorgenfrey, William L. ColePublisher:McDougal Littell
 Elementary AlgebraAlgebraISBN:9780998625713Author:Lynn Marecek, MaryAnne Anthony-SmithPublisher:OpenStax - Rice University
 College Algebra (MindTap Course List)AlgebraISBN:9781305652231Author:R. David Gustafson, Jeff HughesPublisher:Cengage Learning


