
Videos
Superman comic book. In August 2014, a 1938 comic book featuring the first appearance of Superman sold at auction for a record price of $3.2 million. The comic book originally cost
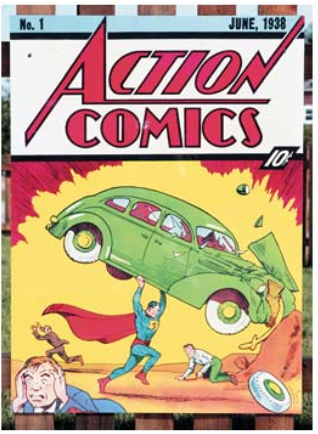
(In the summer of 2010, a family faced foreclosure on their mortgage. As they were packing, they came across some old comic books in the basement, and one of them was a copy of this first Superman comic. They sold it and saved their house.)
a. Find the function that satisfies this equation. Assume that
b. Estimate the value of the comic book in 2020
c. What is the doubling time for the value of the comic book?
d. After what time will the value of the comic book be $30 million, assuming there is no change in the growth rate?
Want to see the full answer?
Check out a sample textbook solution
Chapter 3 Solutions
Calculus and Its Applications (11th Edition)
Additional Math Textbook Solutions
Thinking Mathematically (6th Edition)
Elementary Statistics (13th Edition)
Elementary Statistics: Picturing the World (7th Edition)
A Problem Solving Approach To Mathematics For Elementary School Teachers (13th Edition)
College Algebra with Modeling & Visualization (5th Edition)


- Find the given derivative. Dx 7x 1 6 2 이에arrow_forwardQuestion Consider the graph of f(x) below. Over what open interval is f'(x) positive? Give your answer in interval notation. Provide your answer below: 0arrow_forwardQuestion Find the open interval(s) of f(x), graph given below, where f'(x) is negative. -3-2-1 1 2 4 5 6 Give your answer in interval notation. For example, (2, 4) U (6,∞). Provide your answer below:arrow_forward
- the correct answer is Ccould you please show me how to do it using the residue theoremarrow_forwardUse the information to find and compare Δy and dy. (Round your answers to four decimal places.) y = x4 + 7 x = −3 Δx = dx = 0.01 Δy = dy =arrow_forward4. A car travels in a straight line for one hour. Its velocity, v, in miles per hour at six minute intervals is shown in the table. For each problem, approximate the distance the car traveled (in miles) using the given method, on the provided interval, and with the given number of rectangles or trapezoids, n. Time (min) 0 6 12 18|24|30|36|42|48|54|60 Speed (mph) 0 10 20 40 60 50 40 30 40 40 65 a.) Left Rectangles, [0, 30] n=5 b.) Right Rectangles, [24, 42] n=3 c.) Midpoint Rectangles, [24, 60] n=3 d.) Trapezoids, [0, 24] n=4arrow_forward
- The bracket BCD is hinged at C and attached to a control cable at B. Let F₁ = 275 N and F2 = 275 N. F1 B a=0.18 m C A 0.4 m -0.4 m- 0.24 m Determine the reaction at C. The reaction at C N Z F2 Darrow_forwardThe correct answer is C,i know that we need to use stokes theorem and parametrize the equations then write the equation F with respect to the curve but i cant seem to find a way to do it, the integral should be from 0 to 2pi but i might be wrongcould you show me the steps to get to 18piarrow_forwardA 10-ft boom is acted upon by the 810-lb force as shown in the figure. D 6 ft 6 ft E B 7 ft C 6 ft 4 ft W Determine the tension in each cable and the reaction at the ball-and-socket joint at A. The tension in cable BD is lb. The tension in cable BE is lb. The reaction at A is ( lb) i + Ib) j. (Include a minus sign if necessary.)arrow_forward
- the correct answer is A could you show me whyarrow_forwardGood Day, Kindly assist me with this query.arrow_forwardon donne f(x) da fonction derive dhe do fonction fcsos calcule f'(x) orans chacun des Cas sulants: 3 1) f(x)=5x-11, 2- f (x) = ->³ 3-1(x) = x² 12x +π; 4-f(x)=- 5-f(x) = 33-4x6-609)=-3x²+ 7= f(x) = x + 1.8-f(x) = 4 s-f(x) = x++ X+1 -x-1 2 I 3x-4 девоarrow_forward
 Glencoe Algebra 1, Student Edition, 9780079039897...AlgebraISBN:9780079039897Author:CarterPublisher:McGraw Hill
 Algebra: Structure And Method, Book 1AlgebraISBN:9780395977224Author:Richard G. Brown, Mary P. Dolciani, Robert H. Sorgenfrey, William L. ColePublisher:McDougal Littell