Concept explainers
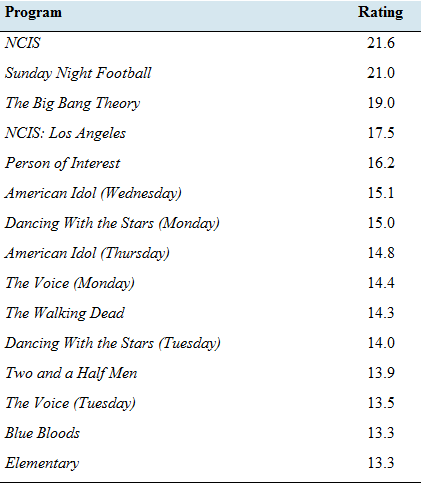
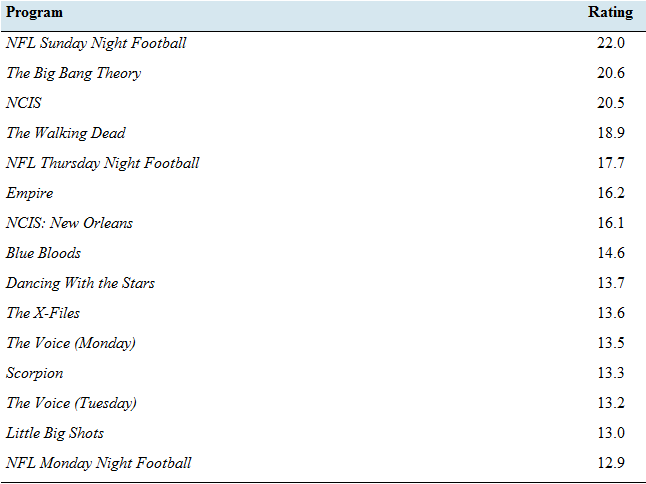
What’s your favorite TV show? The following tables present the numbers of viewers, in millions for the top 15 prime-time shows for the 2012—2013 and 2015—2016 seasons. The numbers of viewers include those who watched the program on any platform, including time-shifting up to seven days after the original telecast.


- Find the population standard deviation of the ratings for 20 12—2013.
- Find the population standard deviation of the ratings for 2015—2016.
- Compute the
range for the ratings for both seasons. - Based on the standard deviations, did the spread in ratings increase or decrease over the two seasons?
- Based on the ranges, did the spread in ratings increase or decrease over the two seasons?
a)
To find: the sample standard deviation of rating 2012 − 2013.
Answer to Problem 39E
Standard deviation = 2.74
Explanation of Solution
Given:
| Top Rated TV Programs: 2012−2013 | Top Rated TV Programs: 2015−2016 | ||
| Program | Rating | Program | Rating |
| NCIS | 21.6 | NFL Sunday Night Football | 22 |
| Sunday Night Football | 21 | The Big Bang Theory | 20.6 |
| The Big Bang Theory | 19 | NCIS | 20.5 |
| NCIS: Los Angeles | 17.5 | The Walking Dead | 18.9 |
| Person of Interest | 16.2 | NFL Thursday Night Football | 17.7 |
| American Idol (Wednesday) | 15.1 | Empire | 16.2 |
| Dancing with the Stars (Monday) | 15 | NCIS: New Orleans | 16.1 |
| American Idol (Thursday) | 14.8 | Blue Bloods | 14.6 |
| The Voice (Monday) | 14.4 | Dancing with the Stars | 13.7 |
| The Walking Dead | 14.3 | The X-Files | 13.6 |
| Dancing with the Stars (Tuesday) | 14 | The Voice (Monday) | 13.5 |
| Two and a Half Men | 13.9 | Scorpion | 13.3 |
| The Voice (Tuesday) | 13.5 | The Voice (Tuesday) | 13.2 |
| Blue Bloods | 13.3 | Little Big Shots | 13 |
| Elementary | 13.3 | NFL Monday Night Football | 12.9 |
Formula used:
Calculation:
| Top Rated TV Programs: 2012−2013 | ||
| Program | Rating | |
| NCIS | 21.6 | 33.72 |
| Sunday Night Football | 21 | 27.11 |
| The Big Bang Theory | 19 | 10.28 |
| NCIS: Los Angeles | 17.5 | 2.91 |
| Person of Interest | 16.2 | 0.17 |
| American Idol (Wednesday) | 15.1 | 0.48 |
| Dancing with the Stars (Monday) | 15 | 0.63 |
| American Idol (Thursday) | 14.8 | 0.99 |
| The Voice (Monday) | 14.4 | 1.94 |
| The Walking Dead | 14.3 | 2.23 |
| Dancing with the Stars (Tuesday) | 14 | 3.22 |
| Two and a Half Men | 13.9 | 3.58 |
| The Voice (Tuesday) | 13.5 | 5.26 |
| Blue Bloods | 13.3 | 6.22 |
| Elementary | 13.3 | 6.22 |
| Sum | 236.90 | 104.95 |
| average | 15.79 | |
| Standard deviation | 2.74 | |
b)
To find: the sample standard deviation for the rating in year 2015 − 2016.
Answer to Problem 39E
Standard deviation = 3.18
Explanation of Solution
Calculation:
| Top Rated TV Programs: 2015−2016 | ||
| Program | Rating | |
| NFL Sunday Night Football | 22 | 36.16 |
| The Big Bang Theory | 20.6 | 21.28 |
| NCIS | 20.5 | 20.37 |
| The Walking Dead | 18.9 | 8.49 |
| NFL Thursday Night Football | 17.7 | 2.94 |
| Empire | 16.2 | 0.05 |
| NCIS: New Orleans | 16.1 | 0.01 |
| Blue Bloods | 14.6 | 1.92 |
| Dancing with the Stars | 13.7 | 5.23 |
| The X-Files | 13.6 | 5.70 |
| The Voice (Monday) | 13.5 | 6.18 |
| Scorpion | 13.3 | 7.22 |
| The Voice (Tuesday) | 13.2 | 7.77 |
| Little Big Shots | 13 | 8.92 |
| NFL Monday Night Football | 12.9 | 9.53 |
| Sum | 239.8 | 141.76 |
| average | 15.99 | |
| Standard deviation | 3.18 | |
c)
To find: the range of ratings for both years.
Answer to Problem 39E
Range:
2012 − 13 = 8.3
2015 − 15 = 9.1
Explanation of Solution
Formula used:
Range = Highest Value − lowest value
Calculation:
d)
To explain: whether the spread has increase or decrease based on standard deviation of both years.
Answer to Problem 39E
Increased
Explanation of Solution
Since the standard deviation in 2012 − 2013 is 2.74 and in year 2015 − 2016 it is 3.18, which shows that the spread of rating has increased over the given time periods.
e)
To explain: whether the spread has increase or decrease based on standard deviation of both years.
Answer to Problem 39E
Increased
Explanation of Solution
Since the Range in 2012 − 2013 is 8.3 and in year 2015 − 2016 it is 9.1, which shows that the spread of rating has increased over the given time periods.
Want to see more full solutions like this?
Chapter 3 Solutions
Elementary Statistics
- (c) Utilize Fubini's Theorem to demonstrate that E(X)= = (1- F(x))dx.arrow_forward(c) Describe the positive and negative parts of a random variable. How is the integral defined for a general random variable using these components?arrow_forward26. (a) Provide an example where X, X but E(X,) does not converge to E(X).arrow_forward
- (b) Demonstrate that if X and Y are independent, then it follows that E(XY) E(X)E(Y);arrow_forward(d) Under what conditions do we say that a random variable X is integrable, specifically when (i) X is a non-negative random variable and (ii) when X is a general random variable?arrow_forward29. State the Borel-Cantelli Lemmas without proof. What is the primary distinction between Lemma 1 and Lemma 2?arrow_forward
 Big Ideas Math A Bridge To Success Algebra 1: Stu...AlgebraISBN:9781680331141Author:HOUGHTON MIFFLIN HARCOURTPublisher:Houghton Mifflin Harcourt
 Glencoe Algebra 1, Student Edition, 9780079039897...AlgebraISBN:9780079039897Author:CarterPublisher:McGraw Hill
 Holt Mcdougal Larson Pre-algebra: Student Edition...AlgebraISBN:9780547587776Author:HOLT MCDOUGALPublisher:HOLT MCDOUGAL
 College Algebra (MindTap Course List)AlgebraISBN:9781305652231Author:R. David Gustafson, Jeff HughesPublisher:Cengage Learning


