Concept explainers
To review:
The relationship between viviparity and cold climates, based on the given phylogenetic tree.
Given:
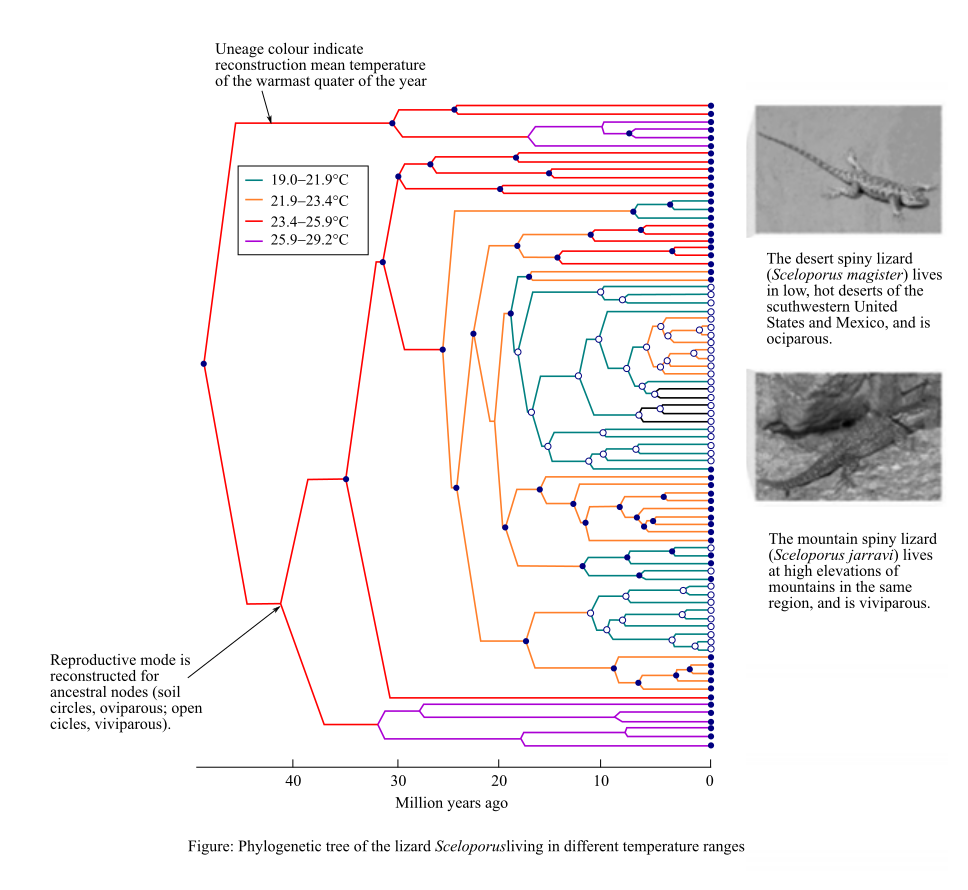
The evolution of viviparity in different lineages of the lizard Sceloporus living in different temperature ranges is shown in Figure 1 of the phylogenetic tree given below:
Introduction:
Animals like birds, reptiles, and amphibians in which the development of the young ones takes place inside the eggs laid by the female are known as oviparous animals. In viviparous animals like mammals, the development of the young ones takes place inside the body of the female who gives birth to the offspring.
Explanation of Solution
It can be observed from the given phylogenetic tree that viviparous mode of reproduction has evolved in the lineages which live in the 19.0–23.4°C temperature range during the warmest months (cool temperature areas).
According to the ‘cold-climate’ hypothesis, animals living in colder climates are more likely to evolve viviparity. In viviparous animals, the development of the young one takes place inside the body of the female and the parent invests more in the development of its offspring.
In areas with a cold climate (high altitudes), the female basks in the sun during the day and move to safe and warm places to take cover during the night. The female can thus regulate the temperature of its body by behavioral thermoregulation. This provides an ambient temperature for the growth and development of the embryo.
An increased parental investment leads to the birth of a few large-sized offspring, which are more capable of surviving to maturity, especially under adverse environmental conditions.
Therefore, it can be concluded that the lizards living in cold areas evolved viviparity because it helped in the better survival of the offspring till maturity.
Want to see more full solutions like this?
Chapter 32 Solutions
LIFE:SCIENCE OF BIOL.(LL) >CUSTOM<


- With reference to their absorption spectra of the oxy haemoglobin intact line) and deoxyhemoglobin (broken line) shown in Figure 2 below, how would you best explain the reason why there are differences in the major peaks of the spectra? Figure 2. SPECTRA OF OXYGENATED AND DEOXYGENATED HAEMOGLOBIN OBTAINED WITH THE RECORDING SPECTROPHOTOMETER 1.4 Abs < 0.8 06 0.4 400 420 440 460 480 500 520 540 560 580 600 nm 1. The difference in the spectra is due to a pH change in the deoxy-haemoglobin due to uptake of CO2- 2. There is more oxygen-carrying plasma in the oxy-haemoglobin sample. 3. The change in Mr due to oxygen binding causes the oxy haemoglobin to have a higher absorbance peak. 4. Oxy-haemoglobin is contaminated by carbaminohemoglobin, and therefore has a higher absorbance peak 5. Oxy-haemoglobin absorbs more light of blue wavelengths and less of red wavelengths than deoxy-haemoglobinarrow_forwardWhich ONE of the following is FALSE regarding haemoglobin? It has two alpha subunits and two beta subunits. The subunits are joined by disulphide bonds. Each subunit covalently binds a haem group. Conformational change in one subunit can be transmitted to another. There are many variant ("mutant") forms of haemoglobin that are not harmful.arrow_forwardWhich ONE of the following is FALSE regarding haemoglobin? It has two alpha subunits and two beta subunits. The subunits are joined by disulphide bonds. Each subunit covalently binds a haem group. Conformational change in one subunit can be transmitted to another. There are many variant ("mutant") forms of haemoglobin that are not harmful.arrow_forward
- During a routine medical check up of a healthy man it was found that his haematocrit value was highly unusual – value of 60%. What one of the options below is the most likely reason? He will have a diet high in iron. He is likely to be suffering from anaemia. He lives at high altitude. He has recently recovered from an accident where he lost a lot of blood. He has a very large body size.arrow_forwardExplain what age of culture is most likely to produce an endospore?arrow_forwardExplain why hot temperatures greater than 45 degrees celsius would not initiate the sporulation process in endospores?arrow_forward
- Endospore stain: Consider tube 2 of the 7-day bacillus culture. After is was heated, it was incubated for 24 hours then refrigerated. Do you think the cloudiness in this tube is due mostly to vegetative cells or to endospores? Explain your reasoningarrow_forwardReactunts C6H12O6 (Glucose) + 2NAD+ + 2ADP 2 Pyruvic acid + 2NADH + 2ATP a. Which of the above are the reactants? b. Which of the above are the products? c. Which reactant is the electron donor? GHz 06 (glucose) d. Which reactant is the electron acceptor? NAD e. Which of the products have been reduced? NADH f. Which of the products have been oxidized? g. Which process was used to produce the ATP? h. Where was the energy initially in this chemical reaction and where is it now that it is finished? i. Where was the carbon initially in this chemical reaction and where is it now that it is finished? j. Where were the electrons initially in this chemical reaction and where is it now that it is finished? 3arrow_forwardThere is ________ the concept of global warming. Very strong evidence to support Some strong evidence to support Evidence both supporting and against Evidence againstarrow_forward
- How many types of reactions can an enzyme perform?arrow_forwardYour goal is to produce black seeds resistant to mold. So you make the same cross again (between a homozygous black seeded, mold susceptible parent and a homozygous white seeded and mold resistant parent), and, again, advance progeny by SSD to create 100 F10 generation plants. Based on the information you obtained from your first crossing experiment (Question #4), how many F10 plants would you expect to have black seeds and be resistant to mold? Assume that a toxin produced by the mold fungus has been isolated. Only mold resistant seeds will germinate in the presence of the toxin. Could you use this toxin screening procedure to have segregation distortion work in your favor in the F2 generation? Explain your answer. Info from Question 4 a. P Locus (Seed Color): Hypothesis: The null hypothesis (H₀) is that seed color is controlled by alleles at a single locus. Observed Data: Total white seeds: 45 (resistant plants) + 6 (susceptible plants) = 51 Total black seeds: 7 (resistant…arrow_forward10. Consider the following enzyme and its substrate where the "+" and "-" indicate cations and anions, respectively. Explain which of the following inhibitors could inhibit this enzyme? Which type of inhibitor would it be and why? (Video 5-2) Substrate Enzyme Potential inhibitorsarrow_forward
 Biology (MindTap Course List)BiologyISBN:9781337392938Author:Eldra Solomon, Charles Martin, Diana W. Martin, Linda R. BergPublisher:Cengage Learning
 Concepts of BiologyBiologyISBN:9781938168116Author:Samantha Fowler, Rebecca Roush, James WisePublisher:OpenStax College
 Biology 2eBiologyISBN:9781947172517Author:Matthew Douglas, Jung Choi, Mary Ann ClarkPublisher:OpenStax
 Biology: The Dynamic Science (MindTap Course List)BiologyISBN:9781305389892Author:Peter J. Russell, Paul E. Hertz, Beverly McMillanPublisher:Cengage Learning
 Biology Today and Tomorrow without Physiology (Mi...BiologyISBN:9781305117396Author:Cecie Starr, Christine Evers, Lisa StarrPublisher:Cengage Learning