EBK STATISTICS FOR BUSINESS & ECONOMICS
12th Edition
ISBN: 8220100460463
Author: Anderson
Publisher: CENGAGE L
expand_more
expand_more
format_list_bulleted
Concept explainers
Textbook Question
Chapter 3.1, Problem 8E
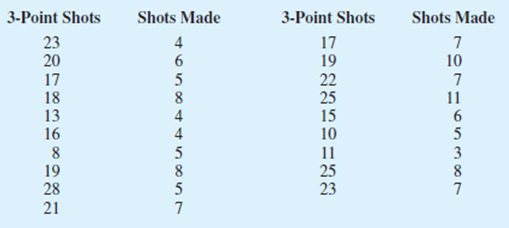
During the 2007-2008 NCAA college basketball season, men’s basketball teams attempted an all-time high number of 3-point shots, averaging 19.07 shots per game (Associated Press Sports, January 24, 2009). In an attempt to discourage so many 3-point shots and encourage more inside play, the NCAA rules committee moved the 3-point line back from 19 feet, 9 inches to 20 feet, 9 inches at the beginning of the 2008–2009 basketball season. Shown in the following table are the 3-point shots taken and the 3-point shots made for a sample of 19 NCAA basketball games during the 2008–2009 season.

- a. What is the
mean number of 3-point shots taken per game? - b. What is the mean number of 3-point shots made per game?
- c. Using the closer 3-point line, players were making 35.2% of their shots. What percentage of shots were players making from the new 3-point line?
- d. What was the impact of the NCAA rules change that moved the 3-point line back to 20 feet. 9 inches for the 2008–2009 season? Would you agree with the Associated Press Sports article that stated. “Moving back the 3-point line hasn’t changed the game dramatically”? Explain.
Expert Solution & Answer
Trending nowThis is a popular solution!

Students have asked these similar questions
As part of the National Health and Nutrition Examination Survey, the Department of Health and Human Services obtained self-reported heights and measured the heights for males aged 12-16. All measurements are in inches. Is there a difference between the reported height vs. the measured height?
Reported Height
68
71
63
71
71
60
65
64
54
63
66
72
Measured Height
67.9
69.9
64.9
68.3
70.3
60.6
64.5
67.0
55.6
74.2
65.0
70.8
Difference
The scores of 15 students in a math test are given below:43 37 59 71 56 62 45 65 51 50 32 58 45 62 76Construct a stem-and-leaf display of their sc
Solve
Chapter 3 Solutions
EBK STATISTICS FOR BUSINESS & ECONOMICS
Ch. 3.1 - Consider a sample with data values of 10, 20, 12,...Ch. 3.1 - Consider a sample with data values of 10, 20, 21,...Ch. 3.1 - Consider the following data and corresponding...Ch. 3.1 - Consider the following data. Period Rate of Return...Ch. 3.1 - Consider a sample with data values of 27, 25, 20,...Ch. 3.1 - Consider a sample with data values of 53, 55, 70,...Ch. 3.1 - The average number of minutes Americans commute to...Ch. 3.1 - During the 2007-2008 NCAA college basketball...Ch. 3.1 - Endowment income is a critical part of the annual...Ch. 3.1 - The cost of consumer purchases such as...
Ch. 3.1 - According to the National Education Association...Ch. 3.1 - The Big Bang Theory, a situation comedy featuring...Ch. 3.1 - In automobile mileage and gasoline-consumption...Ch. 3.1 - The data contained in the file named StateUnemp...Ch. 3.1 - Martinez Auto Supplies has retail stores located...Ch. 3.1 - The grade point average for college students is...Ch. 3.1 - The following table shows the total return and the...Ch. 3.1 - Based on a survey of masters programs in business...Ch. 3.1 - Annual revenue for Corning Supplies grew by 5.5%...Ch. 3.1 - Suppose that at the beginning of 2004 you invested...Ch. 3.1 - If an asset declines in value from 5000 to 3500...Ch. 3.1 - The current value of a company is 25 million. If...Ch. 3.2 - Consider a sample with data values of 10, 20, 12,...Ch. 3.2 - Consider a sample with data values of 10, 20, 12,...Ch. 3.2 - Consider a sample with data values of 27, 25, 20,...Ch. 3.2 - A bowlers scores for six games were 182, 168, 184,...Ch. 3.2 - The results of a search to find the least...Ch. 3.2 - The Australian Open is the first of the four grand...Ch. 3.2 - The Los Angeles times regularly reports the air...Ch. 3.2 - The following data were used to construct the...Ch. 3.2 - The results of Accounting Principals latest...Ch. 3.2 - Prob. 32ECh. 3.2 - Scores turned in by an amateur golfer at the...Ch. 3.2 - The following times were recorded by the...Ch. 3.3 - Consider a sample with data values of 10, 20, 12,...Ch. 3.3 - Consider a sample with a mean of 500 and a...Ch. 3.3 - Consider a sample with a mean of 30 and a standard...Ch. 3.3 - Suppose the data have a bell-shaped distribution...Ch. 3.3 - The results of a national survey showed that on...Ch. 3.3 - The energy information Administration reported...Ch. 3.3 - The national average for the math portion of the...Ch. 3.3 - Many families in California are using backyard...Ch. 3.3 - Florida Power Light (FPL) Company has enjoyed a...Ch. 3.3 - A sample of 10 NCAA college basketball game scores...Ch. 3.3 - The Associated Press Team Marketing Report listed...Ch. 3.4 - Consider a sample with data values of 27, 25, 20,...Ch. 3.4 - Prob. 47ECh. 3.4 - Prob. 48ECh. 3.4 - A data set has a first quartile of 42 and a third...Ch. 3.4 - Naples, Florida, hosts a half-marathon (13.1-mile...Ch. 3.4 - Annual sales, in millions of dollars, for 21...Ch. 3.4 - Consumer Reports provided overall customer...Ch. 3.4 - The Philadelphia Phillies defeated the Tampa Bay...Ch. 3.4 - A listing of 46 mutual funds and their 12-month...Ch. 3.5 - Five observations taken for two variables follow....Ch. 3.5 - Five observations taken for two variables follow....Ch. 3.5 - Ten major college football bowl games were played...Ch. 3.5 - A department of transportations study on driving...Ch. 3.5 - At the beginning of 2009, the economic downturn...Ch. 3.5 - The Dow Jones Industrial Average (DJIA) and the...Ch. 3.5 - Prob. 61ECh. 3 - The average number of times Americans dine out in...Ch. 3 - The U.S. Census Bureau provides statistics on...Ch. 3 - The average waiting time for a patient at an El...Ch. 3 - The U.S. Department of Education reports that...Ch. 3 - Small business owners often look to payroll...Ch. 3 - Public transportation and the automobile are two...Ch. 3 - The National Association of Realtors reported the...Ch. 3 - Prob. 69SECh. 3 - Travel + Leisure magazine provides an annual list...Ch. 3 - Morningstar tracks the performance of a large...Ch. 3 - Does a major league baseball teams record during...Ch. 3 - The days to maturity for a sample of five money...Ch. 3 - Automobiles traveling on a road with a posted...Ch. 3 - The Panama Railroad Company was established in...Ch. 3 - Pelican Stores Pelican Stores, a division of...Ch. 3 - Motion Picture Industry The motion picture...Ch. 3 - Business Schools of Asia-Pacific The pursuit of a...Ch. 3 - Heavenly Chocolates Website Transactions Heavenly...Ch. 3 - African Elephant Populations Although millions of...
Knowledge Booster
Learn more about
Need a deep-dive on the concept behind this application? Look no further. Learn more about this topic, statistics and related others by exploring similar questions and additional content below.Similar questions
- The scores of 15 students in a math test are given below:43 37 59 71 56 62 45 65 51 50 32 58 45 62 76Construct a stem-and-leaf display of their scorarrow_forwardThe Current Results website lists the average annual high and low temperatures (degreesfahrenheit) and average annual snowfall (inches) for fifty-one major U.S. cities, based ondata from 1981 to 2010. The data are contained in the file Snow. for example, the average low temperature for Columbus, Ohio is 44 degrees and the average annual snowfallis 27.5 inches.a. Construct a scatter diagram with the average annual low temperature on the horizontalaxis and the average annual snowfall on the vertical axisarrow_forwardin a survey of 3046 adults age 57 through 85 years, it was found that 85.7 of them use at least one prescription medications. Complete parts a through C below.arrow_forward
- 5) Which type of data is provided in the scenario given below? a.) neither accurate nor precise b.) accurate, but not precise c.) precise, but not accurate d.) precise and accuratearrow_forwardThe results of a survey of visitors at the Eiffel Tower showed that 25 spoke English, 15 spoke French, and 8 spoke both English and French. How many spoke English or French?arrow_forwardQuestion 1 of 17 Suppose Ted is creating a football team in a video game that features many NFL players. He decides to identify players who are outliers in a few statistics he has chosen. Currently, he's looking at wide receivers. The game includes the top 100 receivers in 2012 by number of receptions. Ted, however, is more interested in receiving yards, and the table shows the five-number summary of the available players in the game (in yards): Minimum 1st quartile (Q1) Median 3rd quartile (Q3) Maximum 258.0 549.5 743.0 936.5 1964.0 The mean is 787.6 yds with a standard deviation of 311.3 yds. Ted first calculates the interquartile range (IQR). Next, to determine suspected outliers, he calculates Q1 1.5 IQR and Q3 + 1.5 - IQR. Specify those results to at least one decimal place. Q1 – 1.5 - IQR = Q3 + 1.5 - 1QR = Ted identified the top five receivers available in the game by the number of receiving yards. Player Yards Calvin Johnson 1964 Andre Johnson 1598 Brandon Marshall 1508…arrow_forward
- Draw the scatter diagram of “modules are remaining to complete the degree/diploma and number of hours spend on social media” by using EXCEL and give your interpretation.arrow_forwardA fast-food restaurant monitors its drive-thru Speed of Service (Time in Seconds) 110 service times electronically to ensure that its speed of service is meeting the company's goals. A sample of 16 drive-thru times was recently taken and is shown to the right. 108 101 119 120 95 123 133 112 102 116 109 101 128 100 130 a. Construct a stem and leaf diagram of the speed of service times. b. What range of time might the restaurant say is the most frequent speed of service? a. Complete the stem and leaf diagram below. 9. 10 11 12 13 (Use ascending order.) b. The range of time between seconds is the most frequent speed of service. 130 and 139 100 and 109 90 and 99 120 and 129 110 and 119 Enter your answer in each of the answer boxes.arrow_forwardGiven: Test scores are 59 95 82 78 66 82 65 78 66 79 66 82,66 82. Find the MODE of the test scores.arrow_forward
- Find the range of the number or ounces dispensed by Machine 2 in Table 4.5arrow_forwardComplete the table by filling in the values of LB (lower boundaries) andarrow_forwardA company selling clothing on the Internet reports that the packages it ships have a median weight of 85 ounces and an IQR of 56 ounces. a) The company plans to include a sales flyer weighing 3 ounces in each package. What will the new median and IQR be? b) If the company recorded the shipping weights of the packages with the sales flyers included in pounds instead of ounces, what would the median and IQR be?arrow_forward
arrow_back_ios
SEE MORE QUESTIONS
arrow_forward_ios
Recommended textbooks for you
 Glencoe Algebra 1, Student Edition, 9780079039897...AlgebraISBN:9780079039897Author:CarterPublisher:McGraw Hill
 Algebra: Structure And Method, Book 1AlgebraISBN:9780395977224Author:Richard G. Brown, Mary P. Dolciani, Robert H. Sorgenfrey, William L. ColePublisher:McDougal Littell
 Holt Mcdougal Larson Pre-algebra: Student Edition...AlgebraISBN:9780547587776Author:HOLT MCDOUGALPublisher:HOLT MCDOUGAL

Glencoe Algebra 1, Student Edition, 9780079039897...
Algebra
ISBN:9780079039897
Author:Carter
Publisher:McGraw Hill

Algebra: Structure And Method, Book 1
Algebra
ISBN:9780395977224
Author:Richard G. Brown, Mary P. Dolciani, Robert H. Sorgenfrey, William L. Cole
Publisher:McDougal Littell

Holt Mcdougal Larson Pre-algebra: Student Edition...
Algebra
ISBN:9780547587776
Author:HOLT MCDOUGAL
Publisher:HOLT MCDOUGAL
The Shape of Data: Distributions: Crash Course Statistics #7; Author: CrashCourse;https://www.youtube.com/watch?v=bPFNxD3Yg6U;License: Standard YouTube License, CC-BY
Shape, Center, and Spread - Module 20.2 (Part 1); Author: Mrmathblog;https://www.youtube.com/watch?v=COaid7O_Gag;License: Standard YouTube License, CC-BY
Shape, Center and Spread; Author: Emily Murdock;https://www.youtube.com/watch?v=_YyW0DSCzpM;License: Standard Youtube License