
Concept explainers
Videos
Middle-Level Manager Salaries. Suppose that an independent study of middle-level managers employed at companies located in Atlanta, Georgia, was conducted to compare the salaries of managers working at firms in Atlanta to the salaries of middle-level managers across the nation. The following data show the salary, in thousands of dollars, for a sample of 15 middle-level managers employed at companies in the Atlanta area.

- a. Compute the
median salary for the sample of 15 middle-level managers. Suppose the median salary of middle-level managers employed at companies located across the nation is $85,000. How does the median salary for middle-level managers in the Atlanta area compare to the median for managers across the nation? - b. Compute the
mean annual salary for managers in the Atlanta area and discuss how and why it differs from the median computed in part (a) for Atlanta area managers. - c. Compute the first and third
quartiles for the salaries of middle-level managers in the Atlanta area.
a.
Find the median salary for the sample of 15 middle-level managers.
Compare the median obtained median with the median reported by Wall Street Journal.
Answer to Problem 8E
The median salary for the sample of 15 middle- level managers is $80,000.
Explanation of Solution
Calculation:
The data set represent the salary (in thousand dollars) for a sample of 15 middle-level managers.
Software Procedure:
Step by step procedure to obtain the descriptive statistics using EXCEL is as follows:
- In an EXCEL sheet enter 15 salaries and label it as Salary.
- Go to Data > Data Analysis (in case it is not default, take the Analysis ToolPak from Excel Add Ins) > Descriptive statistics.
- Enter Input Range as $A$2:$A$15, select Columns in Grouped By, tick on Summary statistics.
- Click on OK.
Output using EXCEL is given as follows:
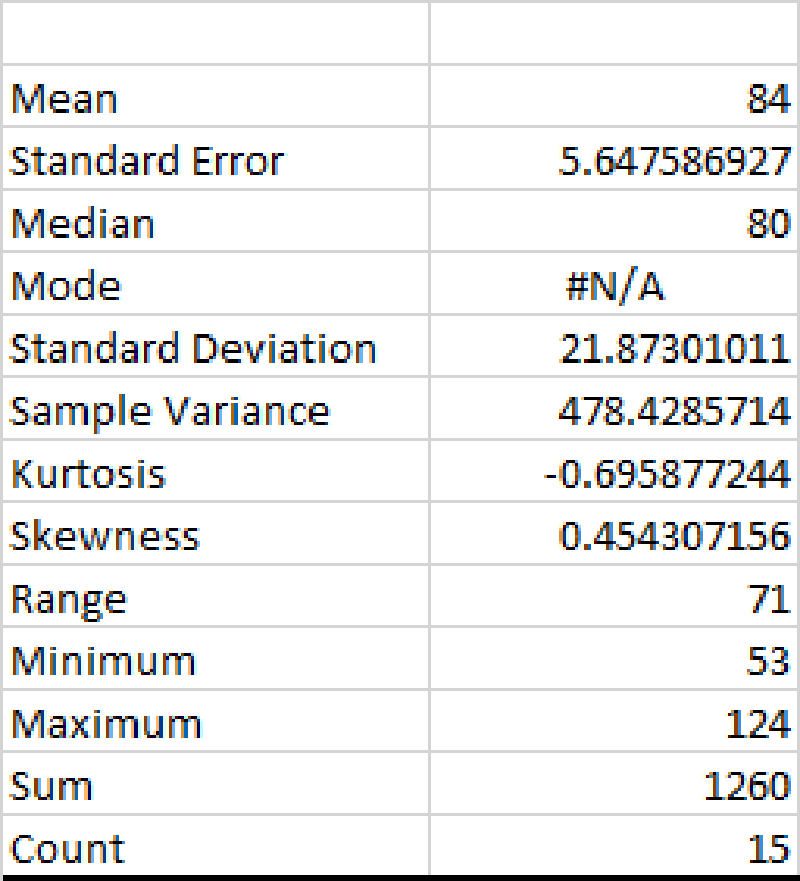
From the EXCEL output, the median salary is 80.
Since, the salary is given in thousand dollars, the median salary for a sample of 15 level managers can be inferred as $80,000.
The Wall Street Journal reported that the median salary for middle-level manager jobs is approximately $85,000.
Here, $80,000 < $85,000.
Therefore, the median salary for the sample of 15 middle-level managers working at firms in City A is slightly lower than the median salary reported by the Wall Street Journal.
b.
Find the mean annual salary.
Explain the reason behind the existence of difference between computed mean and median in part (a).
Answer to Problem 8E
The mean annual salary is $84,000.
The distribution of salaries for middle-level managers working at firms in City A is right skewed.
Explanation of Solution
From the excel output, it is clear that the mean annual salary is 84.
Here, the median salary is less than the mean salary for the sample of 15 middle- level managers.
Skewness:
In statistics, skewness is a measure by which anyone can measure the asymmetrical behaviour of a distribution.
A distribution is said to be symmetric, when its mean, median, and mode are the same. In other words it can be said that, the length of the curve of the left-hand tail will be a mirror image of the right-hand tail.
Therefore, the shape of a distribution can be identified by using the measure of skewness.
Left-skewed:
For a left-skewed distribution,
Right-skewed:
For a right-skewed distribution,
Since, mean is greater than median, it can be inferred that the distribution of annual salary is right or positive skewed.
d.
Obtain the first and third quartiles of the dataset.
Answer to Problem 8E
The first and third quartiles of the dataset are
Explanation of Solution
Calculation:
Quartiles:
Quartiles are those values which divide the data into four equal parts.
Quartiles tells that 25% of the values will be less than the first quartile and 25% of the values will be greater than the third quartile and 50% of the values lies between the first and third quartile with median dividing the parts.
The general formula to obtain the location of
First quartile:
The first quartile
Therefore, the first quartile is the 25th percentile.
The location of 25th percentile is calculated as follows:
Thus, the location of 25th percentile is 4.0.
From this it can be said that, the 25th percentile is 0% of the way between the value in 4th position of ordered dataset and the value in 5th position of ordered dataset.
The dataset of annual salary have to be arranged in ascending order.
The values corresponding to 4th and 5th positions of ordered dataset of annual salaries are 67 and 73.
The 25th percentile is the value in 4th position (67) plus 0.0 times the difference between the value in 4th position and 5th position.
The 25th percentile is obtained as given below:
Hence, the 25th percentile or first quartile is 67.
Third quartile:
The third quartile
Therefore, the third quartile is the 75th percentile.
The location of 75th percentile is calculated as follows:
Thus, the location of 75th percentile is 12.
From this it can be said that, the 75th percentile is 0% of the way between the value in 12th position of ordered dataset and the value in 13th position of ordered dataset.
The dataset of annual salary have to be arranged in ascending order.
The values corresponding to 12th and 13th positions of ordered dataset of annual salaries are 106 and 108.
The 75th percentile is the value in 12th position (106) plus 0.0 times the difference between the value in 12th position and 13th position.
The 75th percentile is obtained as given below:
Hence, the 75th percentile or third quartile is 106.
Thus, the first and third quartiles of the dataset are
Want to see more full solutions like this?
Chapter 3 Solutions
Bundle: Modern Business Statistics with Microsoft Office Excel, Loose-Leaf Version, 6th + MindTap Business Statistics, 2 terms (12 months) Printed Access Card


- D. S. Malik, Data Structures Using C++, 2nd Edition, 2010arrow_forwardMethods (Ch6) - Review 1. (The MyRoot method) Below is a manual implementation of the Math.sqrt() method in Java. There are two methods, method #1 which calculates the square root for positive integers, and method #2, which calculates the square root of positive doubles (also works for integers). public class SquareRoot { public static void main(String[] args) { } // implement a loop of your choice here // Method that calculates the square root of integer variables public static double myRoot(int number) { double root; root=number/2; double root old; do { root old root; root (root_old+number/root_old)/2; } while (Math.abs(root_old-root)>1.8E-6); return root; } // Method that calculates the square root of double variables public static double myRoot(double number) { double root; root number/2; double root_old; do { root old root; root (root_old+number/root_old)/2; while (Math.abs (root_old-root)>1.0E-6); return root; } } Program-it-Yourself: In the main method, create a program that…arrow_forwardI would like to know the main features about the following 3 key concepts:1. Backup Domain Controller (BDC)2. Access Control List (ACL)3. Dynamic Memoryarrow_forward
- In cell C21, enter a formula to calculate the number of miles you expect to drive each month. Divide the value of number of miles (cell A5 from the Data sheet) by the average MPG for the vehicle multiplied by the price of a gallon of gas (cell A6 from the Data sheet).arrow_forwardMicrosoft Excelarrow_forwardIn cell C16, enter a formula to calculate the price of the vehicle minus your available cash (from cell A3 in the Data worksheet). Use absolute references where appropriate—you will be copying this formula across the row what fomula would i use and how do i solve itarrow_forward
- What types of data visualizations or tools based on data visualizations have you used professionally, whether in a current or past position? What types of data did they involve? What, in your experience, is the value these data views or tools added to your performance or productivity?arrow_forwardQuestion: Finding the smallest element and its row index and column index in 2D Array: 1. Write a public Java class min2D. 2. In min2D, write a main method. 3. In the main method, create a 2-D array myArray with 2 rows and 5 columns: {{10, 21, 20, 13, 1}, {2, 6, 7, 8, 14}}. 4. Then, use a nested for loop to find the smallest element and its row index and column index. 5. Print the smallest element and its row index and column index on Java Consolearrow_forward(using R)The iris data set in R gives the measurements in centimeters of the variables sepal length and width andpetal length and width, respectively, for 50 flowers from each of 3 species of iris, setosa, versicolor, andvirginica. Use the iris data set and the t.test function, test if the mean of pepal length of iris flowers isgreater than the mean of sepal length.The iris data set in R gives the measurements in centimeters of the variables sepal length and width andpetal length and width, respectively, for 50 flowers from each of 3 species of iris, setosa, versicolor, andvirginica. Use the iris data set and the t.test function, test if the mean of pepal length of iris flowers isgreater than the mean of sepal length.arrow_forward
- Recognizing the Use of Steganography in Forensic Evidence (4e)Digital Forensics, Investigation, and Response, Fourth Edition - Lab 02arrow_forwardWrite a Java Program to manage student information of a university. The Javaprogram does the following steps:a) The program must use single-dimensional arrays to store the studentinformation such as Student ID, Name and Major.b) The program asks the user to provide the number of students.c) The program asks the user to enter the Student IDs for the number of studentsand stores them.d) The program asks the user to enter the corresponding names for the numberof students and stores them.e) The program then asks the user to provide the corresponding major for thestudents and stores them.f) The program then should display the following options:1. ID Search2. Major Enrollment3. Exitg) On selecting option 1, the user can search for a student using Student ID. Theprogram asks the user to enter a Student ID. It then should print thecorresponding student’s details such as Name and Major if the user providedStudent ID number is present in the stored data. If the user’s Student IDnumber does not…arrow_forward(a) Algebraically determine the output state |q3q2q1q0> (which is a 4-qubitvector in 16-dimensional Hilbert space). Show all steps of your calculations. (b) Run a Qiskit code which implements the circuit and append threemeasurement gates to measure the (partial) output state |q2q1q0> (which is a 3-qubit vector in 8-dimensional Hilbert space). this is for quantum soft dev class, you can use stuff like Deutsch Jozsa if u wantarrow_forward
 Operations Research : Applications and AlgorithmsComputer ScienceISBN:9780534380588Author:Wayne L. WinstonPublisher:Brooks Cole
 A Guide to SQLComputer ScienceISBN:9781111527273Author:Philip J. PrattPublisher:Course Technology Ptr
 Np Ms Office 365/Excel 2016 I NtermedComputer ScienceISBN:9781337508841Author:CareyPublisher:Cengage
 C++ for Engineers and ScientistsComputer ScienceISBN:9781133187844Author:Bronson, Gary J.Publisher:Course Technology PtrCOMPREHENSIVE MICROSOFT OFFICE 365 EXCEComputer ScienceISBN:9780357392676Author:FREUND, StevenPublisher:CENGAGE L