
Statistics for Business & Economics, Revised (MindTap Course List)
12th Edition
ISBN: 9781285846323
Author: David R. Anderson, Dennis J. Sweeney, Thomas A. Williams, Jeffrey D. Camm, James J. Cochran
Publisher: South-Western College Pub
expand_more
expand_more
format_list_bulleted
Videos
Textbook Question
Chapter 3.1, Problem 7E
The average number of minutes Americans commute to work is 27.7 minutes (Sterling’s Best Places, April 13, 2012). The average commute time in minutes for 48 cities are as follows:
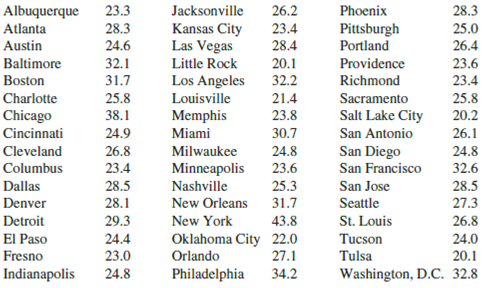
- a. What is the
mean commute time for these 48 cities? - b. Compute the
median commute time. - c. Compute the
mode . - d. Compute the third
quartile .
Expert Solution & Answer

Trending nowThis is a popular solution!

Students have asked these similar questions
a small pond contains eight catfish and six bluegill. If seven fish are caught at random, what is the probability that exactly five catfish have been caught?
23 The line graph in the following figure shows
Revenue ($ millions)
one company's revenues over time. Explain
why this graph is misleading and what you
can do to fix the problem.
700
60-
50-
40
30
Line Graph of Revenue
20-
101
1950
1970
1975 1980 1985
Year
1990
2000
d of the
20
respectively.
Interpret the shape, center and spread of the
following box plot.
14
13
12
11
10
6
T
89
7
9
5.
治
Chapter 3 Solutions
Statistics for Business & Economics, Revised (MindTap Course List)
Ch. 3.1 - Consider a sample with data values of 10, 20, 12,...Ch. 3.1 - Consider a sample with data values of 10, 20, 21,...Ch. 3.1 - Consider the following data and corresponding...Ch. 3.1 - Consider the following data. Period Rate of Return...Ch. 3.1 - Consider a sample with data values of 27, 25, 20,...Ch. 3.1 - Consider a sample with data values of 53, 55, 70,...Ch. 3.1 - The average number of minutes Americans commute to...Ch. 3.1 - During the 2007-2008 NCAA college basketball...Ch. 3.1 - Endowment income is a critical part of the annual...Ch. 3.1 - The cost of consumer purchases such as...
Ch. 3.1 - According to the National Education Association...Ch. 3.1 - The Big Bang Theory, a situation comedy featuring...Ch. 3.1 - In automobile mileage and gasoline-consumption...Ch. 3.1 - The data contained in the file named StateUnemp...Ch. 3.1 - Martinez Auto Supplies has retail stores located...Ch. 3.1 - The grade point average for college students is...Ch. 3.1 - The following table shows the total return and the...Ch. 3.1 - Based on a survey of masters programs in business...Ch. 3.1 - Annual revenue for Corning Supplies grew by 5.5%...Ch. 3.1 - Suppose that at the beginning of 2004 you invested...Ch. 3.1 - If an asset declines in value from 5000 to 3500...Ch. 3.1 - The current value of a company is 25 million. If...Ch. 3.2 - Consider a sample with data values of 10, 20, 12,...Ch. 3.2 - Consider a sample with data values of 10, 20, 12,...Ch. 3.2 - Consider a sample with data values of 27, 25, 20,...Ch. 3.2 - A bowlers scores for six games were 182, 168, 184,...Ch. 3.2 - The results of a search to find the least...Ch. 3.2 - The Australian Open is the first of the four grand...Ch. 3.2 - The Los Angeles times regularly reports the air...Ch. 3.2 - The following data were used to construct the...Ch. 3.2 - The results of Accounting Principals latest...Ch. 3.2 - Prob. 32ECh. 3.2 - Scores turned in by an amateur golfer at the...Ch. 3.2 - The following times were recorded by the...Ch. 3.3 - Consider a sample with data values of 10, 20, 12,...Ch. 3.3 - Consider a sample with a mean of 500 and a...Ch. 3.3 - Consider a sample with a mean of 30 and a standard...Ch. 3.3 - Suppose the data have a bell-shaped distribution...Ch. 3.3 - The results of a national survey showed that on...Ch. 3.3 - The energy information Administration reported...Ch. 3.3 - The national average for the math portion of the...Ch. 3.3 - Many families in California are using backyard...Ch. 3.3 - Florida Power Light (FPL) Company has enjoyed a...Ch. 3.3 - A sample of 10 NCAA college basketball game scores...Ch. 3.3 - The Associated Press Team Marketing Report listed...Ch. 3.4 - Consider a sample with data values of 27, 25, 20,...Ch. 3.4 - Prob. 47ECh. 3.4 - Prob. 48ECh. 3.4 - A data set has a first quartile of 42 and a third...Ch. 3.4 - Naples, Florida, hosts a half-marathon (13.1-mile...Ch. 3.4 - Annual sales, in millions of dollars, for 21...Ch. 3.4 - Consumer Reports provided overall customer...Ch. 3.4 - The Philadelphia Phillies defeated the Tampa Bay...Ch. 3.4 - A listing of 46 mutual funds and their 12-month...Ch. 3.5 - Five observations taken for two variables follow....Ch. 3.5 - Five observations taken for two variables follow....Ch. 3.5 - Ten major college football bowl games were played...Ch. 3.5 - A department of transportations study on driving...Ch. 3.5 - At the beginning of 2009, the economic downturn...Ch. 3.5 - The Dow Jones Industrial Average (DJIA) and the...Ch. 3.5 - Prob. 61ECh. 3 - The average number of times Americans dine out in...Ch. 3 - The U.S. Census Bureau provides statistics on...Ch. 3 - The average waiting time for a patient at an El...Ch. 3 - The U.S. Department of Education reports that...Ch. 3 - Small business owners often look to payroll...Ch. 3 - Public transportation and the automobile are two...Ch. 3 - The National Association of Realtors reported the...Ch. 3 - Prob. 69SECh. 3 - Travel + Leisure magazine provides an annual list...Ch. 3 - Morningstar tracks the performance of a large...Ch. 3 - Does a major league baseball teams record during...Ch. 3 - The days to maturity for a sample of five money...Ch. 3 - Automobiles traveling on a road with a posted...Ch. 3 - The Panama Railroad Company was established in...Ch. 3 - Pelican Stores Pelican Stores, a division of...Ch. 3 - Motion Picture Industry The motion picture...Ch. 3 - Business Schools of Asia-Pacific The pursuit of a...Ch. 3 - Heavenly Chocolates Website Transactions Heavenly...Ch. 3 - African Elephant Populations Although millions of...
Knowledge Booster


Learn more about
Need a deep-dive on the concept behind this application? Look no further. Learn more about this topic, statistics and related others by exploring similar questions and additional content below.Similar questions
- F Make a box plot from the five-number summary: 100, 105, 120, 135, 140. harrow_forward14 Is the standard deviation affected by skewed data? If so, how? foldarrow_forwardFrequency 15 Suppose that your friend believes his gambling partner plays with a loaded die (not fair). He shows you a graph of the outcomes of the games played with this die (see the following figure). Based on this graph, do you agree with this person? Why or why not? 65 Single Die Outcomes: Graph 1 60 55 50 45 40 1 2 3 4 Outcome 55 6arrow_forward
- lie y H 16 The first month's telephone bills for new customers of a certain phone company are shown in the following figure. The histogram showing the bills is misleading, however. Explain why, and suggest a solution. Frequency 140 120 100 80 60 40 20 0 0 20 40 60 80 Telephone Bill ($) 100 120arrow_forward25 ptical rule applies because t Does the empirical rule apply to the data set shown in the following figure? Explain. 2 6 5 Frequency 3 сл 2 1 0 2 4 6 8 00arrow_forward24 Line graphs typically connect the dots that represent the data values over time. If the time increments between the dots are large, explain why the line graph can be somewhat misleading.arrow_forward
- 17 Make a box plot from the five-number summary: 3, 4, 7, 16, 17. 992) waarrow_forward12 10 - 8 6 4 29 0 Interpret the shape, center and spread of the following box plot. brill smo slob.nl bagharrow_forwardSuppose that a driver's test has a mean score of 7 (out of 10 points) and standard deviation 0.5. a. Explain why you can reasonably assume that the data set of the test scores is mound-shaped. b. For the drivers taking this particular test, where should 68 percent of them score? c. Where should 95 percent of them score? d. Where should 99.7 percent of them score? Sarrow_forward
- 13 Can the mean of a data set be higher than most of the values in the set? If so, how? Can the median of a set be higher than most of the values? If so, how? srit to estaarrow_forwardA random variable X takes values 0 and 1 with probabilities q and p, respectively, with q+p=1. find the moment generating function of X and show that all the moments about the origin equal p. (Note- Please include as much detailed solution/steps in the solution to understand, Thank you!)arrow_forward1 (Expected Shortfall) Suppose the price of an asset Pt follows a normal random walk, i.e., Pt = Po+r₁ + ... + rt with r₁, r2,... being IID N(μ, o²). Po+r1+. ⚫ Suppose the VaR of rt is VaRq(rt) at level q, find the VaR of the price in T days, i.e., VaRq(Pt – Pt–T). - • If ESq(rt) = A, find ES₁(Pt – Pt–T).arrow_forward
arrow_back_ios
SEE MORE QUESTIONS
arrow_forward_ios
Recommended textbooks for you
 Glencoe Algebra 1, Student Edition, 9780079039897...AlgebraISBN:9780079039897Author:CarterPublisher:McGraw Hill
 Big Ideas Math A Bridge To Success Algebra 1: Stu...AlgebraISBN:9781680331141Author:HOUGHTON MIFFLIN HARCOURTPublisher:Houghton Mifflin Harcourt
Glencoe Algebra 1, Student Edition, 9780079039897...
Algebra
ISBN:9780079039897
Author:Carter
Publisher:McGraw Hill
Big Ideas Math A Bridge To Success Algebra 1: Stu...
Algebra
ISBN:9781680331141
Author:HOUGHTON MIFFLIN HARCOURT
Publisher:Houghton Mifflin Harcourt
Hypothesis Testing using Confidence Interval Approach; Author: BUM2413 Applied Statistics UMP;https://www.youtube.com/watch?v=Hq1l3e9pLyY;License: Standard YouTube License, CC-BY
Hypothesis Testing - Difference of Two Means - Student's -Distribution & Normal Distribution; Author: The Organic Chemistry Tutor;https://www.youtube.com/watch?v=UcZwyzwWU7o;License: Standard Youtube License