Use a calculator with an y x key to solve Exercises 71-76. The bar graph shows the percentage of U.S. high school seniors who applied to more than three colleges for selected years from 1980 through 2013. The data can he modeled by f ( x ) = x + 31 and g ( x ) = 32 ⋅ 7 e 0 ⋅ 0217 x , in which f(x) and g(x) represent the percentage of high school seniors who applied to more than three colleges x years after 1980. Use these functions to solve Exercises 71-72. Where necessary, round answers to the nearest percent. a. According to the linear model, what percentage of high school seniors applied to more than three colleges in 2010? b. According to the exponential model, what percentage of high school seniors applied to more than three colleges in 20107 c. Which function is a belter model for the data shown by the bar graph in 2010?
Use a calculator with an y x key to solve Exercises 71-76. The bar graph shows the percentage of U.S. high school seniors who applied to more than three colleges for selected years from 1980 through 2013. The data can he modeled by f ( x ) = x + 31 and g ( x ) = 32 ⋅ 7 e 0 ⋅ 0217 x , in which f(x) and g(x) represent the percentage of high school seniors who applied to more than three colleges x years after 1980. Use these functions to solve Exercises 71-72. Where necessary, round answers to the nearest percent. a. According to the linear model, what percentage of high school seniors applied to more than three colleges in 2010? b. According to the exponential model, what percentage of high school seniors applied to more than three colleges in 20107 c. Which function is a belter model for the data shown by the bar graph in 2010?
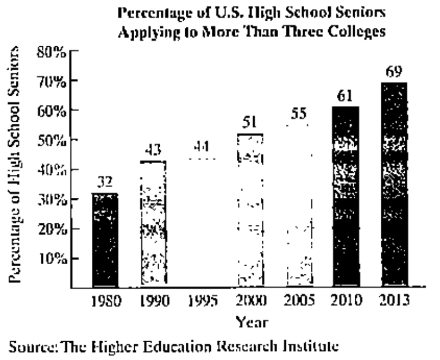
Solution Summary: The author calculates the percentage of high school seniors applying to more than 3 colleges in 2010 based on the linear model f(x)=x+31 where x is the number of years after 1980.
Use a calculator with an
y
x
key to solve Exercises 71-76.
The bar graph shows the percentage of U.S. high school seniors who applied to more than three colleges for selected years from 1980 through 2013.
The data can he modeled by
f
(
x
)
=
x
+
31
and
g
(
x
)
=
32
⋅
7
e
0
⋅
0217
x
,
in which f(x) and g(x) represent the percentage of high school seniors who applied to more than three colleges x years after 1980. Use these functions to solve Exercises 71-72. Where necessary, round answers to the nearest percent.
a. According to the linear model, what percentage of high school seniors applied to more than three colleges in 2010?
b. According to the exponential model, what percentage of high school seniors applied to more than three colleges in 20107
c. Which function is a belter model for the data shown by the bar graph in 2010?
Consider the function f(x) = x²-1.
(a) Find the instantaneous rate of change of f(x) at x=1 using the definition of the derivative.
Show all your steps clearly.
(b) Sketch the graph of f(x) around x = 1. Draw the secant line passing through the points on the
graph where x 1 and x->
1+h (for a small positive value of h, illustrate conceptually). Then,
draw the tangent line to the graph at x=1. Explain how the slope of the tangent line relates to the
value you found in part (a).
(c) In a few sentences, explain what the instantaneous rate of change of f(x) at x = 1 represents in
the context of the graph of f(x). How does the rate of change of this function vary at different
points?
1. The graph of ƒ is given. Use the graph to evaluate each of the following values. If a value does not exist,
state that fact.
и
(a) f'(-5)
(b) f'(-3)
(c) f'(0)
(d) f'(5)
2. Find an equation of the tangent line to the graph of y = g(x) at x = 5 if g(5) = −3 and g'(5)
=
4.
-
3. If an equation of the tangent line to the graph of y = f(x) at the point where x 2 is y = 4x — 5, find ƒ(2)
and f'(2).
Need a deep-dive on the concept behind this application? Look no further. Learn more about this topic, calculus and related others by exploring similar questions and additional content below.


 Algebra & Trigonometry with Analytic GeometryAlgebraISBN:9781133382119Author:SwokowskiPublisher:Cengage
 Glencoe Algebra 1, Student Edition, 9780079039897...AlgebraISBN:9780079039897Author:CarterPublisher:McGraw Hill
 Algebra: Structure And Method, Book 1AlgebraISBN:9780395977224Author:Richard G. Brown, Mary P. Dolciani, Robert H. Sorgenfrey, William L. ColePublisher:McDougal Littell
 Trigonometry (MindTap Course List)TrigonometryISBN:9781337278461Author:Ron LarsonPublisher:Cengage Learning
 College Algebra (MindTap Course List)AlgebraISBN:9781305652231Author:R. David Gustafson, Jeff HughesPublisher:Cengage Learning
 Holt Mcdougal Larson Pre-algebra: Student Edition...AlgebraISBN:9780547587776Author:HOLT MCDOUGALPublisher:HOLT MCDOUGAL