
Loose-leaf For Applied Statistics In Business And Economics
5th Edition
ISBN: 9781259328527
Author: David Doane, Lori Seward Senior Instructor of Operations Management
Publisher: McGraw-Hill Education
expand_more
expand_more
format_list_bulleted
Concept explainers
Videos
Textbook Question
Chapter 3.1, Problem 2SE
(a) Make a stem-and-leaf plot for the number of defects per 100 vehicles for these 32 brands. (b) Make a dot plot of the defects data. (c) Describe these two displays. (Hint: Refer to center, variability, and shape.)
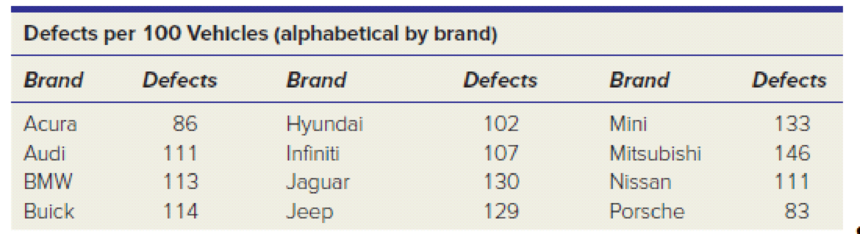
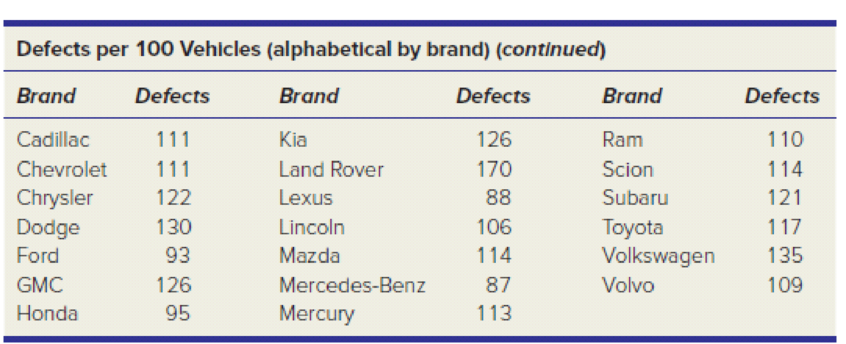
Source: J. D. Power and Associates 2010 Initial Quality StudyTM.
Expert Solution & Answer
Want to see the full answer?
Check out a sample textbook solution
Students have asked these similar questions
Are there any unusually high or low pH levels in this sample of wells?
0
n
AM
RIES
s of
of
10
m
Frequency
40
Frequency
20
20
30
10
You make two histograms from two different
data sets (see the following figures), each
one containing 200 observations. Which of
the histograms has a smaller spread: the first
or the second?
40
30
20
10
0
20
40
60
0
20
20
40
60
60
80
80
100
80
100
TIP
the
aren't, the data are not sym
11
Suppose that the average salary at a certain
company is $100,000, and the median salary
is $40,000.
a. What do these figures tell you about the
shape of the histogram of salaries at this
company?
b. Which measure of center is more appro-
priate here?
c. Suppose that the company goes through a
salary negotiation. How can people on
each side use these summary statistics to
their advantage?
6360 be
52
PART 1 Getting Off to a Statistically Significant S
Chapter 3 Solutions
Loose-leaf For Applied Statistics In Business And Economics
Ch. 3.1 - (a) Make a stem-and-leaf plot for these 24...Ch. 3.1 - (a) Make a stem-and-leaf plot for the number of...Ch. 3.1 - Prob. 3SECh. 3.2 - (a) The table shows the number of days on the...Ch. 3.2 - (a) The table shows raw scores on a state civil...Ch. 3.2 - (a) Make a frequency distribution and histogram...Ch. 3.2 - (a) Make a frequency distribution and histogram...Ch. 3.2 - (a) Make a frequency distribution and histogram...Ch. 3.2 - For each frequency distribution, suggest nice...Ch. 3.2 - Below are sorted data showing average spending per...
Ch. 3.4 - (a) Use Excel to prepare a line chart to display...Ch. 3.4 - Prob. 12SECh. 3.4 - Prob. 13SECh. 3.4 - (a) Use Excel to prepare a line chart to display...Ch. 3.5 - Prob. 15SECh. 3.5 - Prob. 16SECh. 3.6 - (a) Use Excel to prepare a 2-D pie chart for these...Ch. 3.6 - Prob. 19SECh. 3.6 - Prob. 20SECh. 3.7 - (a) Use Excel to make a scatter plot of the data...Ch. 3.7 - Prob. 22SECh. 3.7 - Prob. 23SECh. 3.7 - (a) Use Excel to make a scatter plot of the data,...Ch. 3 - Name two attractive features and two limitations...Ch. 3 - (a) What is a frequency distribution? (b) What are...Ch. 3 - (a) What is a histogram? (b) What does it show?Ch. 3 - (a) What is a bimodal histogram? (b) Explain the...Ch. 3 - (a) What is a scatter plot? (b) What do scatter...Ch. 3 - For what kind of data would we use a bar chart?...Ch. 3 - For what kind of data would we use a line chart?...Ch. 3 - (a) List the three most common types of charts in...Ch. 3 - (a) For what kind of data would we use a pie...Ch. 3 - Which types of charts can be used for time series...Ch. 3 - (a) When might we need a log scale? (b) What do...Ch. 3 - When might we use a stacked column chart? An area...Ch. 3 - List five deceptive graphical techniques.Ch. 3 - What is a pivot table? Why is it useful?Ch. 3 - The durations (minutes) of 26 electric power...Ch. 3 - The U.S. Postal Service will ship a Priority Mail,...Ch. 3 - A study of 40 U.S. cardiac care centers showed the...Ch. 3 - Prob. 28CECh. 3 - Prob. 29CECh. 3 - Below are batting averages of the New York Yankees...Ch. 3 - Download the full data set of measurements of...Ch. 3 - Prob. 32CECh. 3 - Download the full data set from the McGraw-Hill...Ch. 3 - (a) What kind of display is this? (b) Identify its...Ch. 3 - (a) What kind of display is this? (b) Identify its...Ch. 3 - Prob. 36CECh. 3 - (a) What kind of display is this? (b) Identify its...Ch. 3 - Prob. 38CECh. 3 - (a) What kind of display is this? (b) Identify its...Ch. 3 - (a) What kind of display is this? (b) Identify its...Ch. 3 - Prob. 41CECh. 3 - Prob. 42CECh. 3 - (a) Use Excel to prepare an appropriate type of...Ch. 3 - Prob. 44CECh. 3 - Prob. 45CECh. 3 - (a) Use Excel to prepare an appropriate type of...Ch. 3 - Prob. 47CECh. 3 - (a) Use Excel to prepare an appropriate type of...
Knowledge Booster


Learn more about
Need a deep-dive on the concept behind this application? Look no further. Learn more about this topic, statistics and related others by exploring similar questions and additional content below.Similar questions
- 12 Suppose that you know that a data set is skewed left, and you know that the two measures of center are 19 and 38. Which figure is the mean and which is the median?arrow_forwardy of 45 home- televisions u find that 010020 le own one, ee, and 1 owns y histogram of 4 Suppose that you have a loaded die. You roll it several times and record the outcomes, which are shown in the following figure. Histogram for Loaded Die 444% 34.00 48% 6% 2% Frequency 20 20 15 155 10 5- ம 0 1 2 3 4 Outcome 5 6 a. Make a relative frequency histogram of these results. b. You can make a relative frequency histo- gram from a frequency histogram; can you go the other direction?arrow_forwardCalculate the mean for Study Hours and Test Scores. Compute the covariance between the two variables using the formula: Calculate the standard deviation for Study Hours (X) and Test Scores (Y). Determine the correlation coefficient Interpret the results: What does the calculated r-value indicate about the relationship between study hours and test scores?arrow_forward
- For unemployed persons in the United States, the average number of months of unemployment at the end of December 2009 was approximately seven months (Bureau of Labor Statistics, January 2010). Suppose the following data are for a particular region in upstate New York. The values in the first column show the number of months unemployed and the values in the second column show the corresponding number of unemployed persons. Months Unemployed Number Unemployed 1 1029 2 1686 3 2269 4 2675 5 3487 6 4652 7 4145 8 3587 9 2325 10 1120 Let x be a random variable indicating the number of months a person is unemployed. a. Use the data to develop an empirical discrete probability distribution for x (to 4 decimals). (x) f(x) 1 2 3 4 5 6 7 8 9 10 b. Show that your probability distribution satisfies the conditions for a valid discrete probability distribution. The input in the box below will not be graded, but may be reviewed and considered by your instructor. blank c. What is the probability that a…arrow_forwardWest Virginia has one of the highest divorce rates in the nation, with an annual rate of approximately 5 divorces per 1000 people (Centers for Disease Control and Prevention website, January 12, 2012). The Marital Counseling Center, Inc. (MCC) thinks that the high divorce rate in the state may require them to hire additional staff. Working with a consultant, the management of MCC has developed the following probability distribution for x = the number of new clients for marriage counseling for the next year. Excel File: data05-19.xls x 10 f(x) .05 20 30 .10 .10 40 .20 50 60 .35 .20 a. Is this probability distribution valid? - Select your answer- Explain. f(x) Σf(x) Select your answer Select your answer b. What is the probability MCC will obtain more than 30 new clients (to 2 decimals)? c. What is the probability MCC will obtain fewer than 20 new clients (to 2 decimals)? d. Compute the expected value and variance of x. Expected value Variance clients per year squared clients per yeararrow_forwardFor unemployed persons in the United States, the average number of months of unemployment at the end of December 2009 was approximately seven months (Bureau of Labor Statistics, January 2010). Suppose the following data are for a particular region in upstate New York. The values in the first column show the number of months unemployed and the values in the second column show the corresponding number of unemployed persons. Months Unemployed Number Unemployed 1 1029 2 1686 3 2269 4 2675 5 3487 6 4652 7 4145 8 3587 9 2325 10 1120 Let x be a random variable indicating the number of months a person is unemployed. a. Use the data to develop an empirical discrete probability distribution for x (to 4 decimals). (x) f(x) 1 2 3 4 5 6 7 8 9 10 b. Show that your probability distribution satisfies the conditions for a valid discrete probability distribution. The input in the box below will not be graded, but may be reviewed and considered by your instructor. c. What is the probability that a person…arrow_forward
- In Gallup's Annual Consumption Habits Poll, telephone interviews were conducted for a random sample of 1014 adults aged 18 and over. One of the questions was "How many cups of coffee, if any, do you drink on an average day?" The following table shows the results obtained (Gallup website, August 6, 2012). Excel File: data05-23.xls Number of Cups per Day Number of Responses 0 365 264 193 3 4 or more 91 101 Define a random variable x = number of cups of coffee consumed on an average day. Let x = 4 represent four or more cups. Round your answers to four decimal places. a. Develop a probability distribution for x. x 0 1 2 3 4 f(x) b. Compute the expected value of x. cups of coffee c. Compute the variance of x. cups of coffee squared d. Suppose we are only interested in adults that drink at least one cup of coffee on an average day. For this group, let y = the number of cups of coffee consumed on an average day. Compute the expected value of y. Compare it to the expected value of x. The…arrow_forwardIn Gallup's Annual Consumption Habits Poll, telephone interviews were conducted for a random sample of 1014 adults aged 18 and over. One of the questions was "How many cups of coffee, if any, do you drink on an average day?" The following table shows the results obtained (Gallup website, August 6, 2012). Excel File: data05-23.xls Number of Cups per Day Number of Responses 0 365 264 193 2 3 4 or more 91 101 Define a random variable x = number of cups of coffee consumed on an average day. Let x = 4 represent four or more cups. Round your answers to four decimal places. a. Develop a probability distribution for x. x 0 1 2 3 f(x) b. Compute the expected value of x. cups of coffee c. Compute the variance of x. cups of coffee squared d. Suppose we are only interested in adults that drink at least one cup of coffee on an average day. For this group, let y = the number of cups of coffee consumed on an average day. Compute the expected value of y. Compare it to the expected value of x. The…arrow_forwardA technician services mailing machines at companies in the Phoenix area. Depending on the type of malfunction, the service call can take 1, 2, 3, or 4 hours. The different types of malfunctions occur at about the same frequency. Develop a probability distribution for the duration of a service call. Duration of Call x f(x) 1 2 3 4 Which of the following probability distribution graphs accurately represents the data set? Consider the required conditions for a discrete probability function, shown below.Does this probability distribution satisfy equation (5.1)?Does this probability distribution satisfy equation (5.2)? What is the probability a service call will take three hours? A service call has just come in, but the type of malfunction is unknown. It is 3:00 P.M. and service technicians usually get off at 5:00 P.M. What is the probability the service technician will have to work overtime to fix the machine today?arrow_forward
- A psychologist determined that the number of sessions required to obtain the trust of a new patient is either 1, 2, or 3. Let x be a random variable indicating the number of sessions required to gain the patient's trust. The following probability function has been proposed. x f(x) for x = 1, 2, or 3 a. Consider the required conditions for a discrete probability function, shown below. f(x) ≥0 Σf(x) = 1 (5.1) (5.2) Does this probability distribution satisfy equation (5.1)? Select Does this probability distribution satisfy equation (5.2)? Select b. What is the probability that it takes exactly 2 sessions to gain the patient's trust (to 3 decimals)? c. What is the probability that it takes at least 2 sessions to gain the patient's trust (to 3 decimals)?arrow_forwardA technician services mailing machines at companies in the Phoenix area. Depending on the type of malfunction, the service call can take 1, 2, 3, or 4 hours. The different types of malfunctions occur at about the same frequency. Develop a probability distribution for the duration of a service call. Which of the following probability distribution graphs accurately represents the data set? Consider the required conditions for a discrete probability function, shown below.Does this probability distribution satisfy equation (5.1)?Does this probability distribution satisfy equation (5.2)? What is the probability a service call will take three hours? A service call has just come in, but the type of malfunction is unknown. It is 3:00 P.M. and service technicians usually get off at 5:00 P.M. What is the probability the service technician will have to work overtime to fix the machine today?arrow_forwardWest Virginia has one of the highest divorce rates in the nation, with an annual rate of approximately 5 divorces per 1000 people (Centers for Disease Control and Prevention website, January 12, 2012). The Marital Counseling Center, Inc. (MCC) thinks that the high divorce rate in the state may require them to hire additional staff. Working with a consultant, the management of MCC has developed the following probability distribution for x = the number of new clients for marriage counseling for the next year. Excel File: data05-19.xls 10 20 f(x) .05 .10 11 30 40 50 60 .10 .20 .35 .20 a. Is this probability distribution valid? Yes Explain. greater than or equal to 0 f(x) Σf(x) equal to 1 b. What is the probability MCC will obtain more than 30 new clients (to 2 decimals)? c. What is the probability MCC will obtain fewer than 20 new clients (to 2 decimals)? d. Compute the expected value and variance of x. Expected value Variance clients per year squared clients per yeararrow_forward
arrow_back_ios
SEE MORE QUESTIONS
arrow_forward_ios
Recommended textbooks for you
 Glencoe Algebra 1, Student Edition, 9780079039897...AlgebraISBN:9780079039897Author:CarterPublisher:McGraw Hill
 Big Ideas Math A Bridge To Success Algebra 1: Stu...AlgebraISBN:9781680331141Author:HOUGHTON MIFFLIN HARCOURTPublisher:Houghton Mifflin Harcourt
 Holt Mcdougal Larson Pre-algebra: Student Edition...AlgebraISBN:9780547587776Author:HOLT MCDOUGALPublisher:HOLT MCDOUGAL
Glencoe Algebra 1, Student Edition, 9780079039897...
Algebra
ISBN:9780079039897
Author:Carter
Publisher:McGraw Hill
Big Ideas Math A Bridge To Success Algebra 1: Stu...
Algebra
ISBN:9781680331141
Author:HOUGHTON MIFFLIN HARCOURT
Publisher:Houghton Mifflin Harcourt
Holt Mcdougal Larson Pre-algebra: Student Edition...
Algebra
ISBN:9780547587776
Author:HOLT MCDOUGAL
Publisher:HOLT MCDOUGAL
Correlation Vs Regression: Difference Between them with definition & Comparison Chart; Author: Key Differences;https://www.youtube.com/watch?v=Ou2QGSJVd0U;License: Standard YouTube License, CC-BY
Correlation and Regression: Concepts with Illustrative examples; Author: LEARN & APPLY : Lean and Six Sigma;https://www.youtube.com/watch?v=xTpHD5WLuoA;License: Standard YouTube License, CC-BY